The EUR/USD is building a correction with lower highs and higher lows. Price action seems to be in a bearish ABC pattern within a bullish wave B. What are the key levels to consider?
Price Charts and Technical Analysis
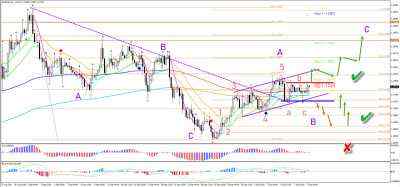
The EUR/USD support (blue line) and resistance (red line) levels are key for determining the next price swing. A bullish breakout above the resistance indicates a completed bearish ABC (red) within wave B (purple) and a continuation higher within the wave C (purple). The targets are the Fibonacci levels although the main Fib target is confluence of the -61.8% Fib and 78.6% Fib at 1.1925. A bearish breakout indicates a downside move towards the Fibonacci retracement levels of wave B (purple). This remains valid as long as price remains above the 100% Fibonacci level.The EUR/USD 1 hour chart is showing the current indecisiveness well. A bullish breakout above the resistance (red box) confirms a completed ABC (red). But a bearish breakout below the support (blue box) indicates that the waves B and C will shift forward (red arrows). The bulls are expected to keep control, either after the breakout or after a bounce at the Fibonacci retracement levels.

Reprinted from Fxempire,the copyright all reserved by the original author.
คำชี้แจง (Disclaimer) : เนื้อหาข้างต้นเป็นเพียงมุมมองของผู้เขียนแต่เพียงผู้เดียว และไม่ได้แสดงหรือสะท้อนถึงจุดยืนอย่างเป็นทางการของ Followme แต่อย่างใด Followme ไม่รับผิดชอบต่อความถูกต้อง ความครบถ้วน หรือความน่าเชื่อถือของข้อมูลที่ปรากฏ และจะไม่รับผิดชอบต่อการดำเนินการใด ๆ ที่เกิดขึ้นจากเนื้อหานั้น เว้นแต่จะมีการระบุไว้เป็นลายลักษณ์อักษรอย่างชัดเจน

เขียนข้อความของคุณตอนนี้