Gold prices are virtually unchanged for the week with a holding pattern in view heading into today’s highly anticipated FOMC rate decision. A recovery of more than 3.4% takes XAU/USD into monthly open resistance with a near-term range in focus as we head into the Fed. These are the updated targets and invalidation levels that matter on the XAU/USD technical charts heading into the close of the week. Review my latest Strategy Webinar for an in-depth breakdown of this gold technical setup and more.
GOLD PRICE CHART - XAU/USD
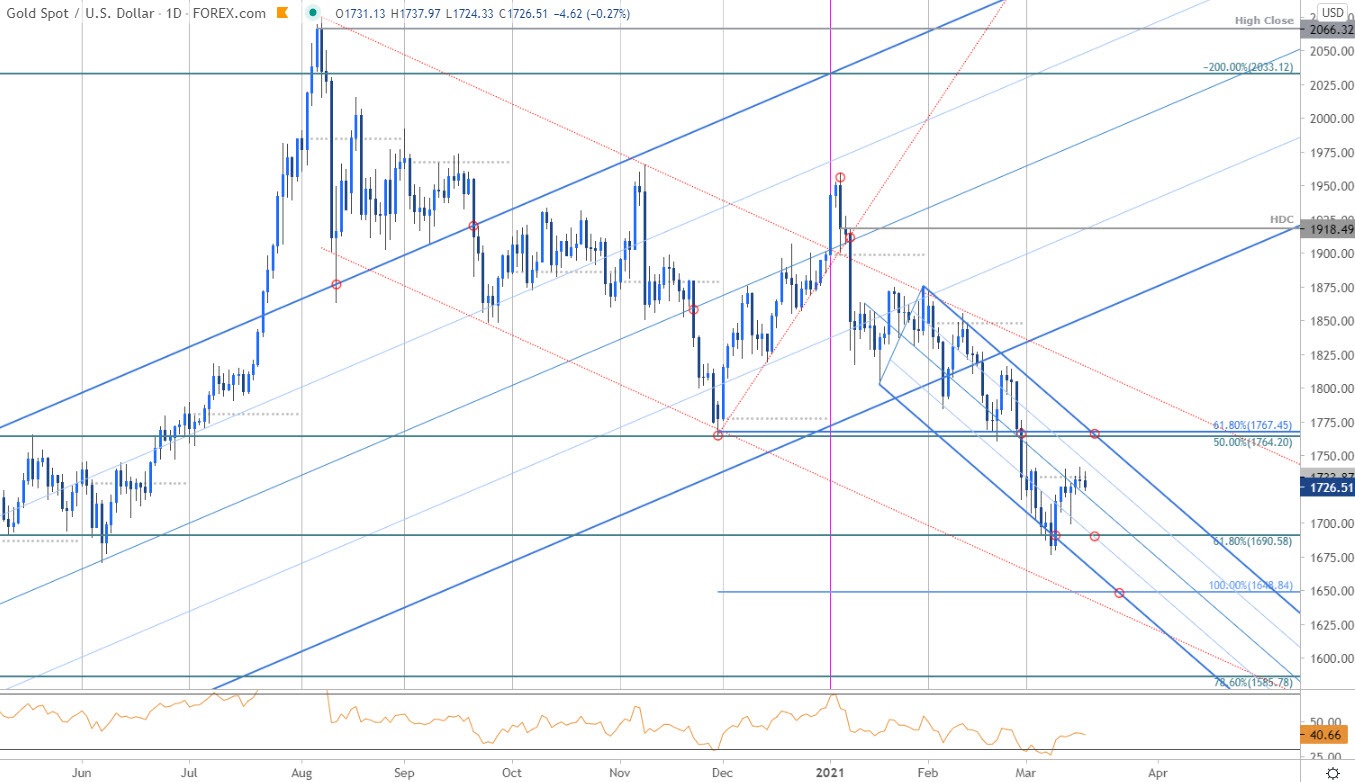
Technical Outlook: In my last Gold Price Outlook we noted that the XAU/USD breakdown was, “testing the first major hurdle at downtrend support early in the month and we’re on the lookout for possible inflection into this region.” The confluence zone in question was 1690- a region defined by the lower parallel and the 61.8% Fibonacci retracement of the 2020 yearly range. Gold briefly registered an intraday low at 1676 before reversing sharply higher with the advance halting at monthly open resistance near 1734.
Key daily resistance / bearish invalidation remains unchanged at 1764/67- a breach / close above this threshold would be needed to suggest a more significant low was registered last week. Weekly support steady at 1690 with a break there exposing the 100% extension at 1649- an area of interest for possible downside exhaustion IF reached.
คำชี้แจง (Disclaimer) : เนื้อหาข้างต้นเป็นเพียงมุมมองของผู้เขียนแต่เพียงผู้เดียว และไม่ได้แสดงหรือสะท้อนถึงจุดยืนอย่างเป็นทางการของ Followme แต่อย่างใด Followme ไม่รับผิดชอบต่อความถูกต้อง ความครบถ้วน หรือความน่าเชื่อถือของข้อมูลที่ปรากฏ และจะไม่รับผิดชอบต่อการดำเนินการใด ๆ ที่เกิดขึ้นจากเนื้อหานั้น เว้นแต่จะมีการระบุไว้เป็นลายลักษณ์อักษรอย่างชัดเจน

เขียนข้อความของคุณตอนนี้