· Views 1,943
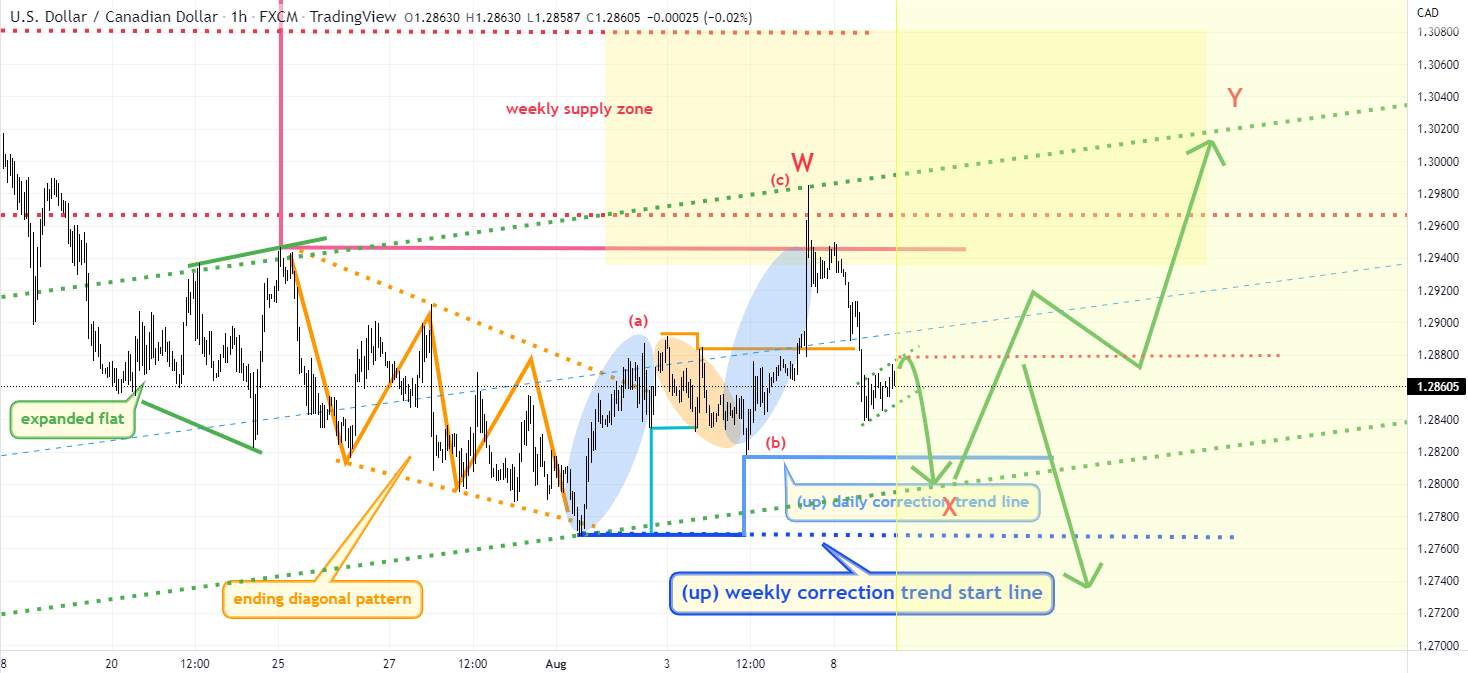
USDCAD is a daily bullish pattern , but if the daily correction trend line breaks and rebounds, there are two cases.
The first can be a daily bullish pattern with a reversal structure, with the starting line being the weekly correction trend starting line. The second can be a W-X-Y pattern of a complex structure. That is, after reaching the weekly supply zone once more, it creates a weekly correction trend line to the right of the downtrend and becomes a pattern that can fall again. If it rises strongly in the weekly supply zone , it could be followed by a daily upward wave with the first one being extended. However, if the correction start line is broken, the above two will become invalid, and it will become a daily downward wave pattern. #OPINIONLEADER#
คำชี้แจง (Disclaimer) : เนื้อหาข้างต้นเป็นเพียงมุมมองของผู้เขียนแต่เพียงผู้เดียว และไม่ได้แสดงหรือสะท้อนถึงจุดยืนอย่างเป็นทางการของ Followme แต่อย่างใด Followme ไม่รับผิดชอบต่อความถูกต้อง ความครบถ้วน หรือความน่าเชื่อถือของข้อมูลที่ปรากฏ และจะไม่รับผิดชอบต่อการดำเนินการใด ๆ ที่เกิดขึ้นจากเนื้อหานั้น เว้นแต่จะมีการระบุไว้เป็นลายลักษณ์อักษรอย่างชัดเจน
ชอบบทความนี้ไหม? แสดงความขอบคุณโดยการส่งทิปให้ผู้เขียน

เขียนข้อความของคุณตอนนี้