*Gold Broke the Triangle –But Will It Be Able To Retest Key Psychological Mark of 2050*
*Previous Trading Session*
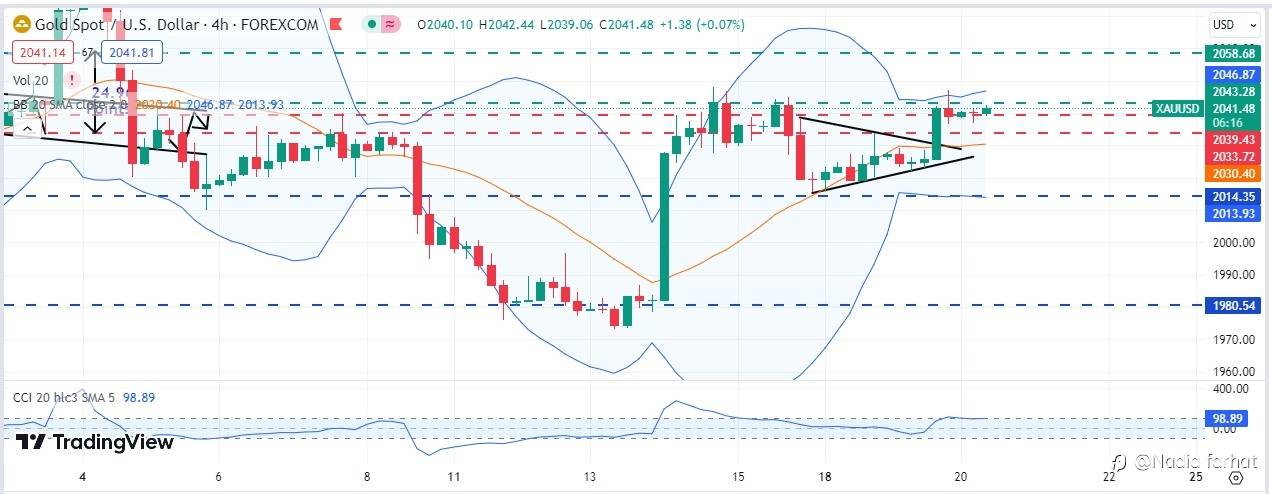
• On Tuesday, gold gave a bullish breakout out of the symmetrical triangle pattern and made highs of 2047.05,
• However, minor corrections were witnessed from the highs and gold ended the trading day above 2039.43.
*Current Situation*
• On Wednesday, gold looks steady near 2-week highs near 2040.
• It has sustained above the key support of 2039.43, which was previously acting as resistance.
*Analysis*
• The gold seems to be driven by the weakness in the US dollar.
• The US treasury yield on the benchmark 10-year note was down about 2 basis points at 3.933%, having fallen below 4%.
• Further, Sticky inflation in the Euro Zone raises the probability of further rate hikes, which has negatively impacted dollar prices.
• On Tuesday, Euro Zone announced a little lower inflation data, but experts still find inflation on the higher side and express higher probabilities of rate hikes in the upcoming months.
• Higher Inflation -> rate hikes in Euro Zone -> provide minor strength to Euro -> weaken US dollar -> strengthen gold
• Furthermore, bullish sentiments favoring gold receive support from geopolitical risks and concerns regarding an economic slowdown in China.
*Technical Indicators:*
• Gold is currently trending in a buying zone as per technical indicators, which signals further bullishness.
• Gold on Wednesday hovers above the middle band of the Bollinger Band as visible on the attached H4 chart.
• The CCI levels also hover in the buying zone near 98.25 levels.
*Projection:*
• Nothing has changed for Gold and it still looks uncertain, hence, take your trades very cautiously.
• The choppy movement will continue till the US session, in which important CB Consumer Confidence and Existing Home Sales data is going to be released.
*Important Levels to Watch*
*It is noteworthy that our previously given levels during late November are still respected by the gold prices – as visible on the attached H4 chart of Gold*
• Resistance: A bullish acceptance above 2041.15 is significant for the Gold price to resume its journey higher toward the 2050 psychological level and 2058.68.
• Support: To begin a declining trend, gold must give a daily closing below 2033.72. Below the correction mode will begin with the next support at 2014.35
↘️⬇️⬇️⬇️⬇️⬇️⬇️⬇️⬇️⬇️⬇️⬇️⬇️⬇️⬇️⬇️↙️
To join our free premium group. DM me
#XAU/USD# #gold# #GOLDTODAY# #CanGoldRetake2000?# #Commodities# #Metals# #preciousmetal# #forexmarket# #FOREX# #Todayanalysis# #analysis# #fundamentalsanalysis# #technicalanalysis#
คำชี้แจง (Disclaimer) : เนื้อหาข้างต้นเป็นเพียงมุมมองของผู้เขียนแต่เพียงผู้เดียว และไม่ได้แสดงหรือสะท้อนถึงจุดยืนอย่างเป็นทางการของ Followme แต่อย่างใด Followme ไม่รับผิดชอบต่อความถูกต้อง ความครบถ้วน หรือความน่าเชื่อถือของข้อมูลที่ปรากฏ และจะไม่รับผิดชอบต่อการดำเนินการใด ๆ ที่เกิดขึ้นจากเนื้อหานั้น เว้นแต่จะมีการระบุไว้เป็นลายลักษณ์อักษรอย่างชัดเจน

เขียนข้อความของคุณตอนนี้