



ByLCMS Traders FX Analysis Team
JUN 25, 2021
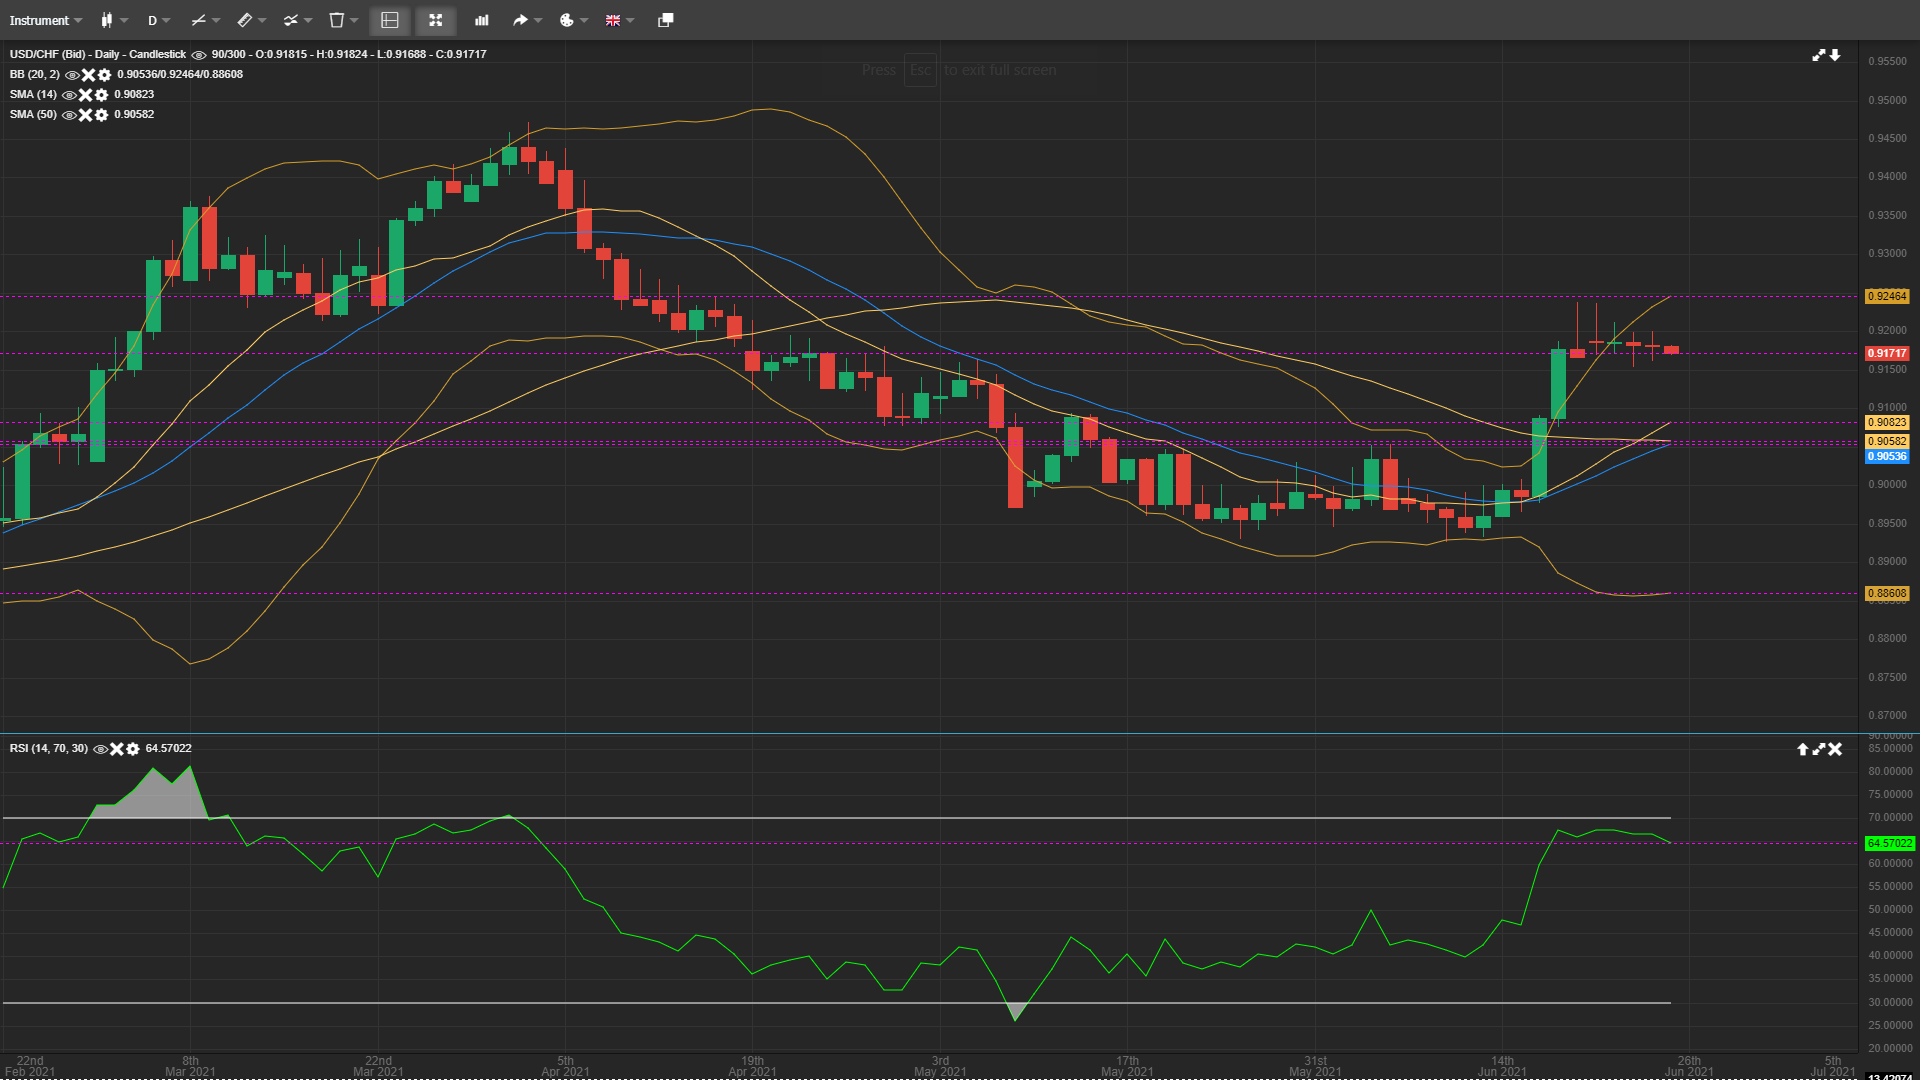
USD/CHF bulls have stalled near the 0.9200 resistance zone after recovering from the recent low of 0.8935. The pair is currently trading at 0.9171 with immediate resistance levels at 0.9200 and 0.9228. The intraday support levels are at 0.9170 and 0.9148.
On the intraday charts, multiple Doji formations at the peak are the indication of exhausted bulls. The RSI is 64 and now has a downwards curve. The SMA-14 is indicating support at 0.9082 and the SMA-50 support area is at 0.9052. The pair is also keeping above the mid-Bollinger band. The upper and lower bands are at 0.9246 and 0.8860 respectively. Considering the stiff resistance around the current price levels and following the intraday price pattern, the pair is ideal for selling entries at the following levels
Direction: Sell
Entry: 0.9190
Take Profit Range: 0.9155 – 0.9140
Stop-Loss: 0.9215
A weekly closing at or below 0.9160 would be supportive of the bears and they would in a better position to challenge the 0.9100 mark during the next week. On the upside, bulls require sustained price action to breach above the 0.9200 resistance area to move further higher.
คำชี้แจง (Disclaimer) : เนื้อหาข้างต้นเป็นเพียงมุมมองของผู้เขียนแต่เพียงผู้เดียว และไม่ได้แสดงหรือสะท้อนถึงจุดยืนอย่างเป็นทางการของ Followme แต่อย่างใด Followme ไม่รับผิดชอบต่อความถูกต้อง ความครบถ้วน หรือความน่าเชื่อถือของข้อมูลที่ปรากฏ และจะไม่รับผิดชอบต่อการดำเนินการใด ๆ ที่เกิดขึ้นจากเนื้อหานั้น เว้นแต่จะมีการระบุไว้เป็นลายลักษณ์อักษรอย่างชัดเจน

