


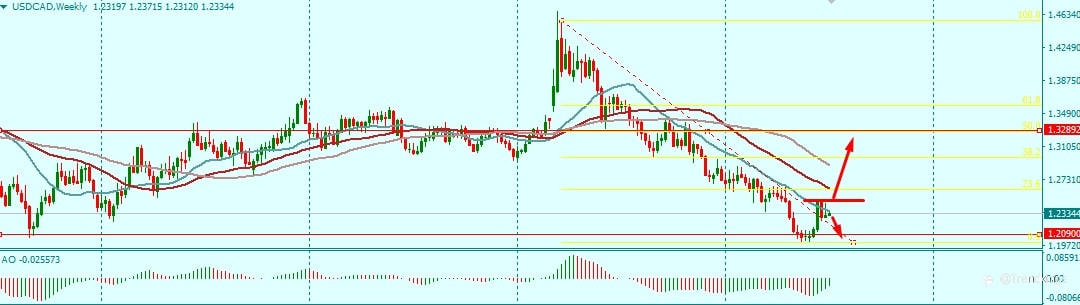
For the past 1 year, USDCAD Weekly has been on a classic downtrend. On March 2020, Price found a major resistance at 1.4642, and from the weekly candle view, price has repeated a perfect LL and LH pattern and has formed below the EMAs till date. Price hits 1.2090 monthly support level, forming a LL where price retraced to 1.2490 which is another key resistance level. Price at 1.2490 respects not only the 20 EMA, but it’s also in symmetry with a previous LH.
In my opinion there are various possible outcomes for the USDCAD; price may fall to form a double bottom; Price may breakout to the upside as the current weekly LL was formed at a strong Monthly Support level, there has also been a breakout of a weekly trend line. Who knows if the current climatic condition in Canada may also weaken its currency?
Disclaimer: What I have shared above is not a financial or investment advice of any sort, it’s just for educational purposes only, whatever trading decision you make is at your own risk.
คำชี้แจง (Disclaimer) : เนื้อหาข้างต้นเป็นเพียงมุมมองของผู้เขียนแต่เพียงผู้เดียว และไม่ได้แสดงหรือสะท้อนถึงจุดยืนอย่างเป็นทางการของ Followme แต่อย่างใด Followme ไม่รับผิดชอบต่อความถูกต้อง ความครบถ้วน หรือความน่าเชื่อถือของข้อมูลที่ปรากฏ และจะไม่รับผิดชอบต่อการดำเนินการใด ๆ ที่เกิดขึ้นจากเนื้อหานั้น เว้นแต่จะมีการระบุไว้เป็นลายลักษณ์อักษรอย่างชัดเจน

