



ByLCMS Traders FX Analysis Team
JUL 15, 2021
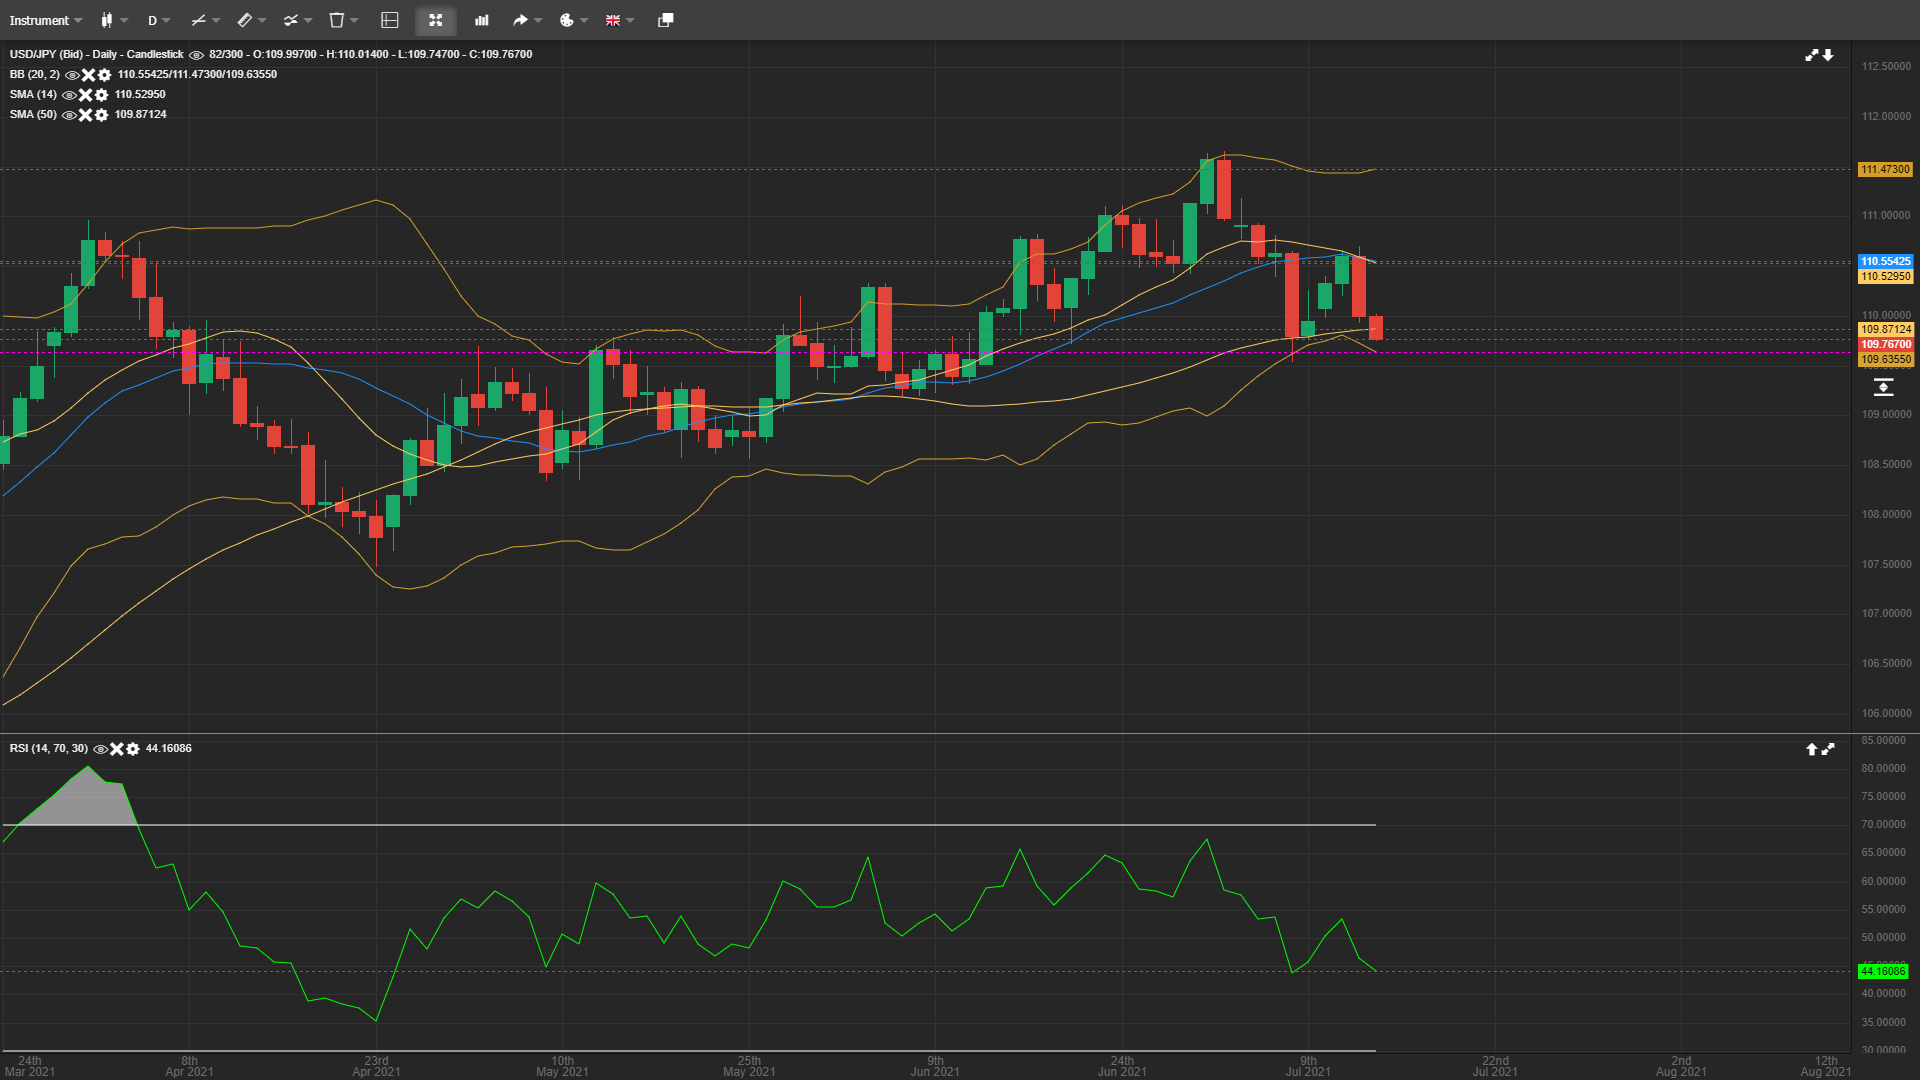
USD/JPY dropped nearly 60 yesterday and is currently trading further lower to 109.76. The intraday support levels are at 10.9.60 and 109.35. The near-term resistance areas are at 110.10 and 110.54.
The intraday charts are presenting a bearish picture. The SMA-14 is indicating resistance at 110.52 and the SMA-50 support line is at 109.87. The RSI is at 44 and has a downwards curve. The MACD is below the middle line and indicating a bearish trajectory. The pair is also keeping below the mid-Bollinger band (110.55). The current price range (109.70) was previous held during the last week however, the intraday and 4 hourly charts now suggest further weakness which makes the pair ideal for short entries using the following levels.
Direction: Sell
Entry: 110.00
Take Profit: 109.45
Stop-Loss: 110.36
An intraday closing below 109.50 would be an indication of further weakness and a lower weekly closing. On the upside, a sustained price action above 110.30 is needed for the bulls to get back into the game.
คำชี้แจง (Disclaimer) : เนื้อหาข้างต้นเป็นเพียงมุมมองของผู้เขียนแต่เพียงผู้เดียว และไม่ได้แสดงหรือสะท้อนถึงจุดยืนอย่างเป็นทางการของ Followme แต่อย่างใด Followme ไม่รับผิดชอบต่อความถูกต้อง ความครบถ้วน หรือความน่าเชื่อถือของข้อมูลที่ปรากฏ และจะไม่รับผิดชอบต่อการดำเนินการใด ๆ ที่เกิดขึ้นจากเนื้อหานั้น เว้นแต่จะมีการระบุไว้เป็นลายลักษณ์อักษรอย่างชัดเจน

