


· Views 282
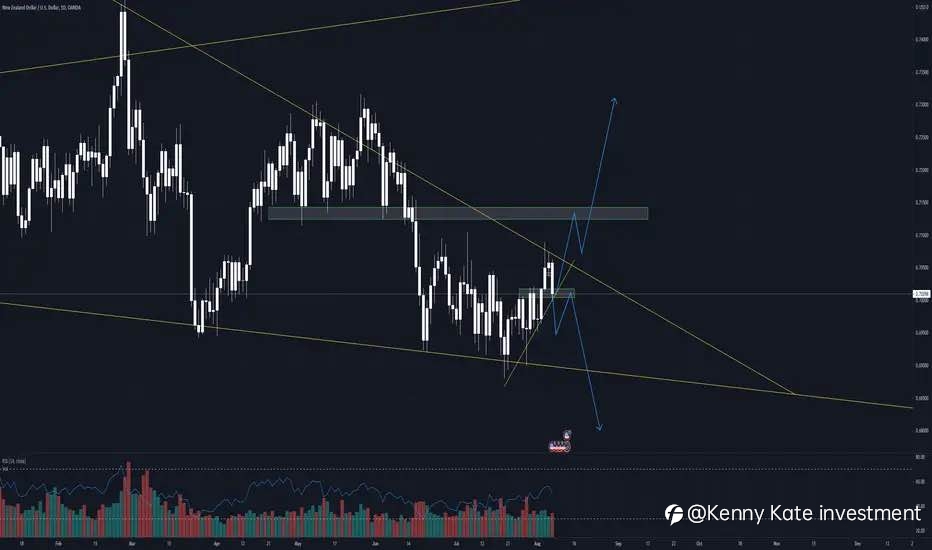
On this daily chart of NZDUSD , I am seeing a wedge pattern for this pair. So far, it is creating higher lows in the lower time frames (30 minutes,1 and 4 hour). As long as it holds this area around 0.7010 where my green rectangle is, I would be leaning more towards it breaking out. However, if it breaks below that, then there's a likelihood of NZDUSD coming down to re-test the lows around 0.6900.
We'll see next week and good luck trading!
We'll see next week and good luck trading!
คำชี้แจง (Disclaimer) : เนื้อหาข้างต้นเป็นเพียงมุมมองของผู้เขียนแต่เพียงผู้เดียว และไม่ได้แสดงหรือสะท้อนถึงจุดยืนอย่างเป็นทางการของ Followme แต่อย่างใด Followme ไม่รับผิดชอบต่อความถูกต้อง ความครบถ้วน หรือความน่าเชื่อถือของข้อมูลที่ปรากฏ และจะไม่รับผิดชอบต่อการดำเนินการใด ๆ ที่เกิดขึ้นจากเนื้อหานั้น เว้นแต่จะมีการระบุไว้เป็นลายลักษณ์อักษรอย่างชัดเจน
ชอบบทความนี้ไหม? แสดงความขอบคุณโดยการส่งทิปให้ผู้เขียน

