
#OPINIONLEADER# #Exness# #EUR/USD#
Loonie eyes a Shooting Star as EURO faces a Falling Wedge,AUSSIE left behind a Hammer, STERLING eyes triangle support.
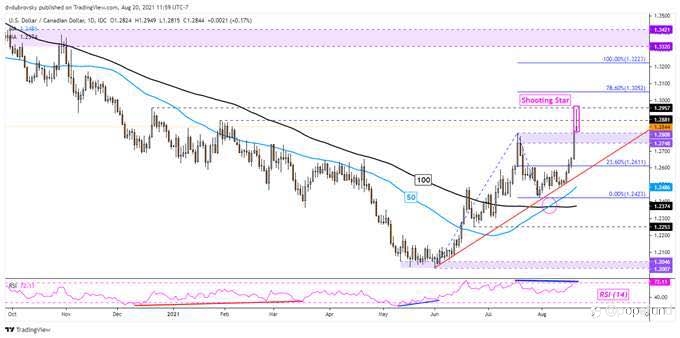
The USD's aggressive push last week ended on an uncertain footing against the Loonie last week. While Loonie touched new 2021 highs at one point, prices came quickly back down on Friday. That left behind a bearish
‘Shooting Star’ candlestick pattern indicating a turn lower could be on the horizon, it does offer an ominous warning sign working in conjunction with negative RSI divergence. Confirmation is key, and a subsequent downside close risks opening the door to losses.
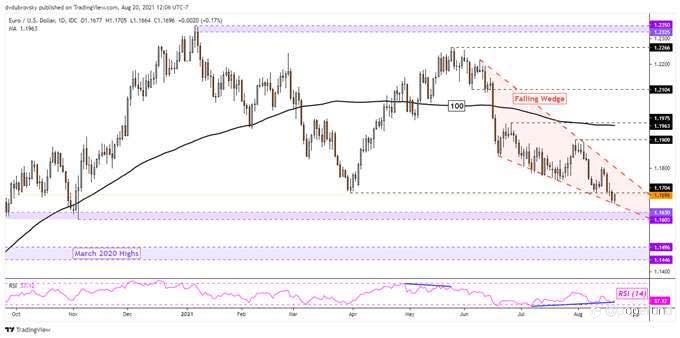
The Euro remains tilted to the downside against the US Dollar, with EURO consolidating lower within the boundaries of a bullish Falling Wedge chart pattern. While the latter can have upside implications, that may
not become realized until a breakout above the formation is achieved. Until then, the US Dollar may continue outperforming. Prices are quickly approaching the critical 1.1603 – 1.1630 support zone. Breaking under this zone could open the door to extending the downtrend towards highs from March 2020.
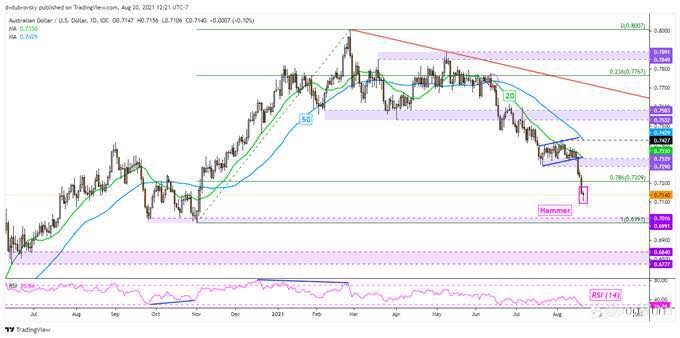
The USD touched its most expensive point against the Aussie this year so far. But, similar to LOONIE, Aussie trimmed some of its progress on Friday. That left behind a bullish Hammer candlestick pattern. Upside closes in the following trading sessions could hint at a material turning point for the Aussie. Despite this, the dominant downtrend still remains in play, guided lower by the 20- and 50-day Simple Moving Averages (SMAs). In the event of more declines, keep a close eye on the 0.6991 – 0.7016 support zone.
Sterling also weakened against the USD this past week, with GBP’s consolidating lower within the boundaries of a Descending Triangle chart pattern. The pair is closely eyeing the 1.3572 – 1.3671 support zone. This well-established range has the potential to send prices back higher towards the
ceiling of the triangle. Positive RSI divergence does show that downside
momentum is fading. At the same time, prices confirmed a break under the
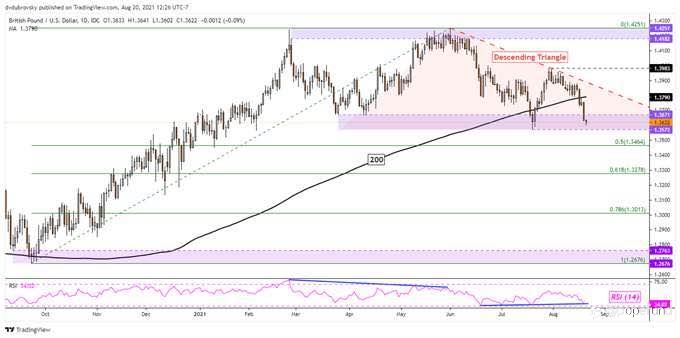
200-day SMA, opening the door to a material turn lower.
คำชี้แจง (Disclaimer) : เนื้อหาข้างต้นเป็นเพียงมุมมองของผู้เขียนแต่เพียงผู้เดียว และไม่ได้แสดงหรือสะท้อนถึงจุดยืนอย่างเป็นทางการของ Followme แต่อย่างใด Followme ไม่รับผิดชอบต่อความถูกต้อง ความครบถ้วน หรือความน่าเชื่อถือของข้อมูลที่ปรากฏ และจะไม่รับผิดชอบต่อการดำเนินการใด ๆ ที่เกิดขึ้นจากเนื้อหานั้น เว้นแต่จะมีการระบุไว้เป็นลายลักษณ์อักษรอย่างชัดเจน