


Hello fellow traders. In this technical blog, we’re going to take a quick look at the Elliott Wave charts of GBPAUD, published in the member's area of the website. As our members know, we’ve been calling rallies in the Forex Pair. The pair made a pullback that has had a form of Elliott Wave Zig Zag pattern. We expected GBPAUD to find buyers at the extreme zone from the 08/20 peak. In the further text, we are going to explain the Elliott Wave Pattern and trading strategy.
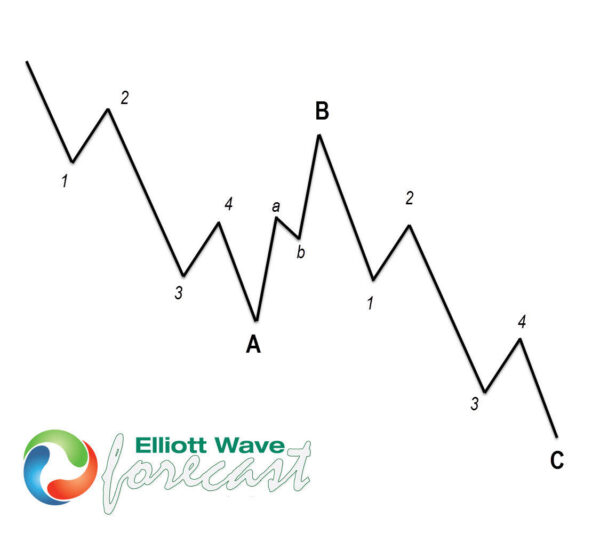
Before we take a look at the real market example, let’s explain Elliott Wave Zigzag.
Elliott Wave Zigzag is the most popular corrective pattern in Elliott Wave theory. It’s made of 3 swings which have 5-3-5 inner structures. Inner swings are labeled as A, B, C where A =5 waves, B=3 waves, and C=5 waves. That means A and C can be either impulsive waves or diagonals. (Leading Diagonal in case of wave A or Ending in case of wave C) . Waves A and C must meet all conditions of being 5 wave structures, such as: having RSI divergence between wave subdivisions, ideal Fibonacci extensions, and ideal retracements.
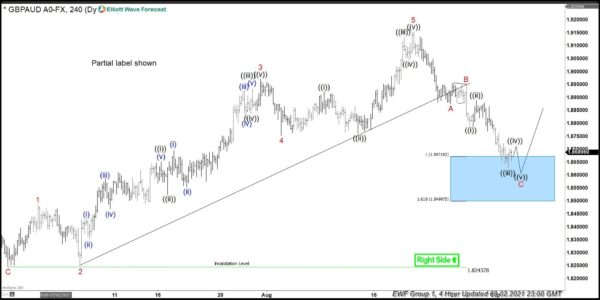
GBP/AUD Elliott Wave 1 hour chart 09.02.2021
In the chart below we can see what the Elliott Wave Zig Zag pattern looks like in the real market. Pull back reached equal legs at 1.86718-1.84997 (buyers zone). The first leg of the– A red, has subdivided into 5 waves. Then we got B red that has the form of a Triangle Structure. Finally doing C red that should have 5 waves. Currently, we can be doing ((iv)) of Cred. Once bounce completes another leg down within the blue box should ideally follow. We don’t recommend selling the pair and favor the long side from the blue box area. Once bounce reaches 50 Fibs against the B red high, we will make the long position risk-free ( put SL at BE). As our members know, Blue Boxes are no enemy areas, giving us an 85% chance to get a bounce.
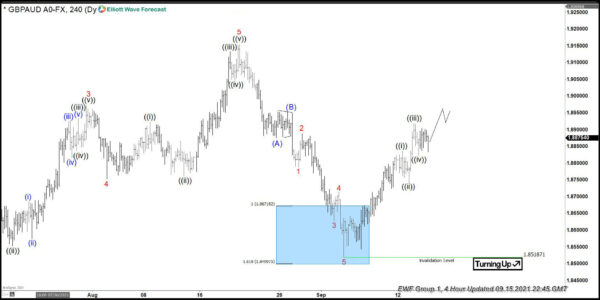
GBP/AUD Elliott Wave 1 hour chart 09.02.2021
The pair made another wave down within the blue box area and found buyers as we expected. We got a nice reaction from the blue box, which reached and exceeded 50 fibs against the connector, so any long trades from the blue box should be risk-free at this stage. Cycle from the peak is counted completed at 1.85187 low. Now we would like to stay long from the blue box and not forcing new trades until the 08/20 peak gets broken. In that case, GBPAUD will have again bullish sequences and will offer new long opportunities in 3,7,11 swings.
คำชี้แจง (Disclaimer) : เนื้อหาข้างต้นเป็นเพียงมุมมองของผู้เขียนแต่เพียงผู้เดียว และไม่ได้แสดงหรือสะท้อนถึงจุดยืนอย่างเป็นทางการของ Followme แต่อย่างใด Followme ไม่รับผิดชอบต่อความถูกต้อง ความครบถ้วน หรือความน่าเชื่อถือของข้อมูลที่ปรากฏ และจะไม่รับผิดชอบต่อการดำเนินการใด ๆ ที่เกิดขึ้นจากเนื้อหานั้น เว้นแต่จะมีการระบุไว้เป็นลายลักษณ์อักษรอย่างชัดเจน

