


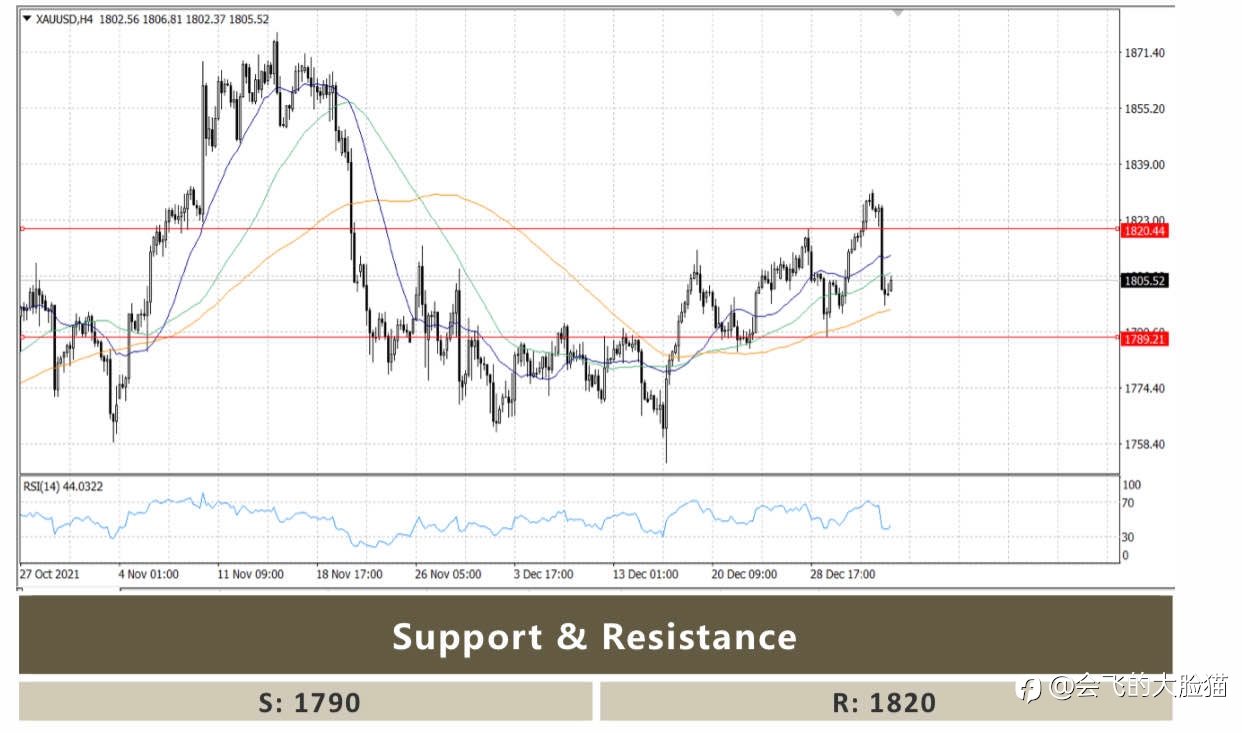
#XAU/USD# The 4-hour chart shows that the price has fallen below its 20 and 200 SMAs, while approaching a mildly bullish 100 SMA, reflecting sellers’ strength. Meanwhile, the Momentum indicator is crossing its midline into negative territory, while the RSI indicator heads lower at around 44, all of which hints at a bearish continuation, particularly on a break below $1,790, the immediate support level. #gold#
คำชี้แจง (Disclaimer) : เนื้อหาข้างต้นเป็นเพียงมุมมองของผู้เขียนแต่เพียงผู้เดียว และไม่ได้แสดงหรือสะท้อนถึงจุดยืนอย่างเป็นทางการของ Followme แต่อย่างใด Followme ไม่รับผิดชอบต่อความถูกต้อง ความครบถ้วน หรือความน่าเชื่อถือของข้อมูลที่ปรากฏ และจะไม่รับผิดชอบต่อการดำเนินการใด ๆ ที่เกิดขึ้นจากเนื้อหานั้น เว้นแต่จะมีการระบุไว้เป็นลายลักษณ์อักษรอย่างชัดเจน

