


· Views 1,231
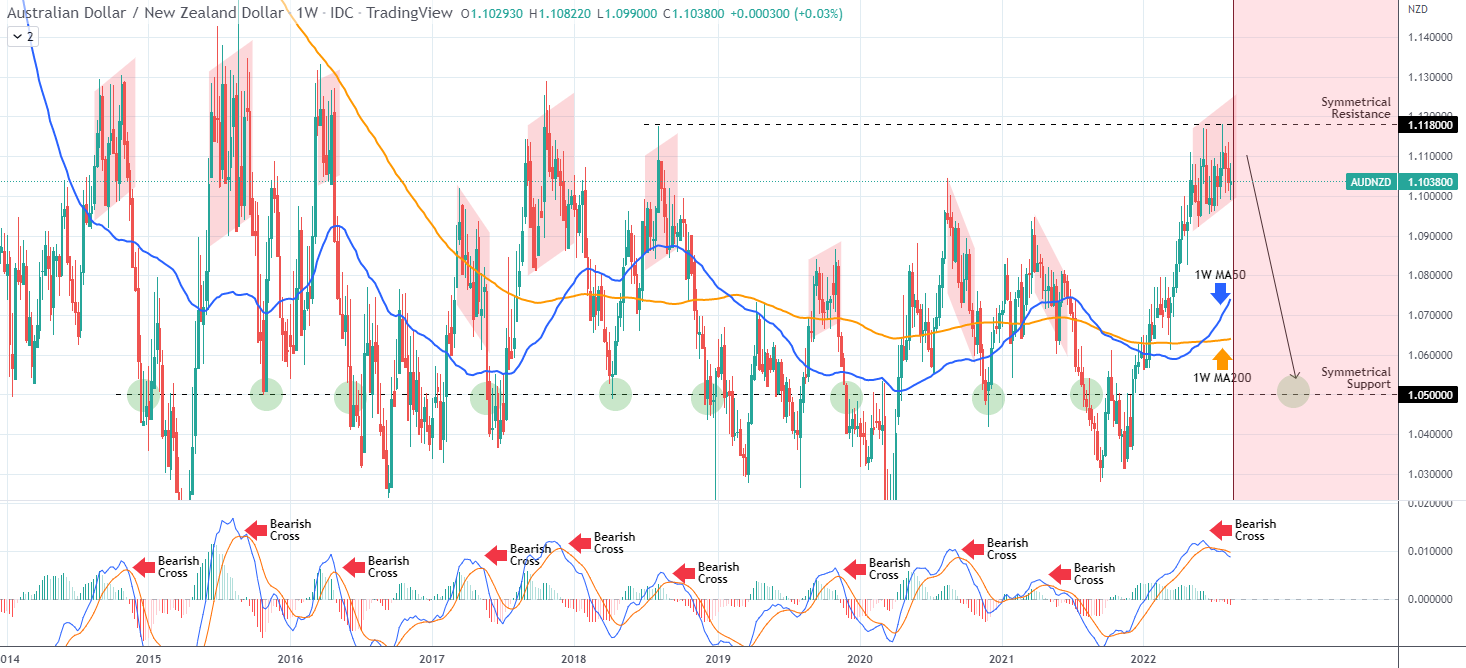
The AUDNZD pair is trading within a Channel Up since the start of May but has most likely peaked based on this unique pattern going back 8 years.
The chart is on the 1W time-frame where the MACD is trading downwards after a late June Bearish Cross. As you see, every such Bearish Cross above the 0.0 MACD level, formed a long-term Top on either a Channel Up or Down pattern since 2014. All the downtrends that followed this peak formation were sharp sell-offs that dropped to at least the 1.0500 level (symmetrical Support) even though most reached a lot lower.
As a result since we are still inside the Channel Up pattern, this could be the best place for a sell position this year. You can use three target levels: the 1W MA50 (blue trend-line) short-term, the 1W MA200 (orange trend-line) medium-term and the 1.0500 Symmetrical Support for the long-term. #OPINIONLEADER#
คำชี้แจง (Disclaimer) : เนื้อหาข้างต้นเป็นเพียงมุมมองของผู้เขียนแต่เพียงผู้เดียว และไม่ได้แสดงหรือสะท้อนถึงจุดยืนอย่างเป็นทางการของ Followme แต่อย่างใด Followme ไม่รับผิดชอบต่อความถูกต้อง ความครบถ้วน หรือความน่าเชื่อถือของข้อมูลที่ปรากฏ และจะไม่รับผิดชอบต่อการดำเนินการใด ๆ ที่เกิดขึ้นจากเนื้อหานั้น เว้นแต่จะมีการระบุไว้เป็นลายลักษณ์อักษรอย่างชัดเจน
ชอบบทความนี้ไหม? แสดงความขอบคุณโดยการส่งทิปให้ผู้เขียน

