


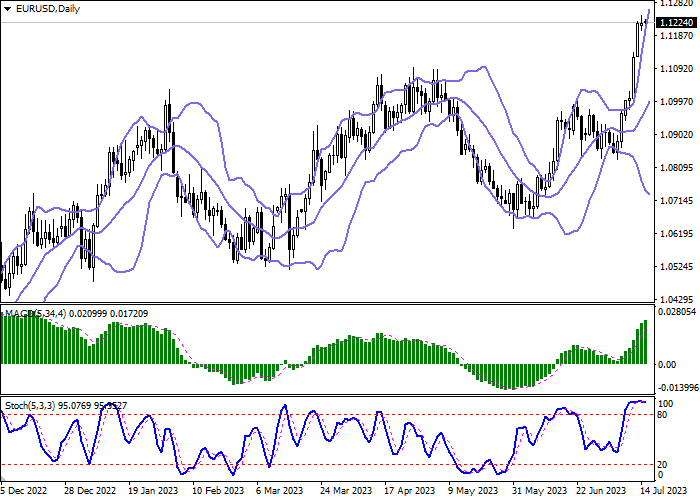
| Scenario | |
|---|---|
| Timeframe | Intraday |
| Recommendation | BUY STOP |
| Entry Point | 1.1245 |
| Take Profit | 1.1350 |
| Stop Loss | 1.1200 |
| Key Levels | 1.1050, 1.1100, 1.1150, 1.1200, 1.1243, 1.1300, 1.1350, 1.1400 |
| Alternative scenario | |
|---|---|
| Recommendation | SELL STOP |
| Entry Point | 1.1200 |
| Take Profit | 1.1100 |
| Stop Loss | 1.1243 |
| Key Levels | 1.1050, 1.1100, 1.1150, 1.1200, 1.1243, 1.1300, 1.1350, 1.1400 |
Current trend
The EUR/USD pair shows mixed trading dynamics, consolidating near 1.1220 and the all-time highs of February 2022, updated at the end of last week.
Data released last week showed a sharp slowdown in consumer inflation, pushing the dollar to new multi-month lows as market participants bolstered confidence that the Fed's monetary tightening cycle is about to end. Annual inflation fell from 4.0% to 3.0%, which was quite close to market forecasts of a decline to 3.1%. At the moment, about 63.0% of analysts expect only one additional interest rate hike from the regulator, which is likely to take place during the July meeting. After that, the policy of the US Fed is likely to remain unchanged for a long time, and at the beginning of next year, a return to the cycle of reducing the cost of borrowing is not ruled out.
In turn, the European Central Bank (ECB) still intends to further tighten monetary conditions and does not generate signals for a possible adjustment of the interest rate. The focus of the market this week will be the June statistics on inflation in the euro area, which will appear on Wednesday, July 19. Forecasts assume that the Consumer Price Index in the region will remain at 0.3% MoM and 5.5% YoY, while the Core CPI is expected to be at 0.3% and 5.4%, respectively. In addition, last week, investors assessed the June data on the Wholesale Price Index in Germany: the indicator increased from -1.1% to -0.2% on a monthly basis and decreased from -2.6% to -2.9% on an annualized basis instead of rising to -1.2%. German manufacturers continue to cut prices amid weakening demand for products, and the continuation of this trend could exacerbate the current downturn in the economy.
Support and resistance
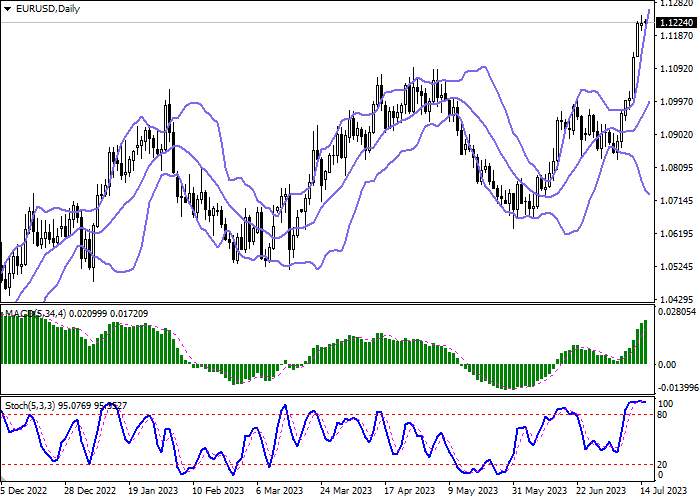
Bollinger Bands on the daily chart show a steady increase. The price range is expanding, but it fails to keep up with the activity of the "bulls" at the moment. MACD grows, preserving a stable buy signal (located above the signal line). Stochastic, having reached its highs, reversed into a horizontal plane, indicating risks of overbought euro in the ultra-short term.
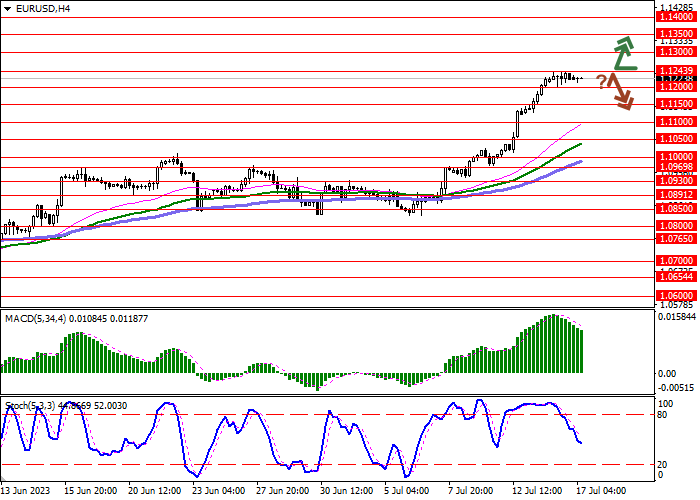
Resistance levels: 1.1243, 1.1300, 1.1350, 1.1400.
Support levels: 1.1200, 1.1150, 1.1100, 1.1050.
Trading tips
Long positions can be opened after a breakout of 1.1243 with the target of 1.1350. Stop-loss — 1.1200. Implementation time: 1-2 days.
A rebound from 1.1243 as from resistance, followed by a breakdown of 1.1200 may become a signal for opening of new short positions with the target at 1.1100. Stop-loss — 1.1243.
คำชี้แจง (Disclaimer) : เนื้อหาข้างต้นเป็นเพียงมุมมองของผู้เขียนแต่เพียงผู้เดียว และไม่ได้แสดงหรือสะท้อนถึงจุดยืนอย่างเป็นทางการของ Followme แต่อย่างใด Followme ไม่รับผิดชอบต่อความถูกต้อง ความครบถ้วน หรือความน่าเชื่อถือของข้อมูลที่ปรากฏ และจะไม่รับผิดชอบต่อการดำเนินการใด ๆ ที่เกิดขึ้นจากเนื้อหานั้น เว้นแต่จะมีการระบุไว้เป็นลายลักษณ์อักษรอย่างชัดเจน

