


| Scenario | |
|---|---|
| Timeframe | Weekly |
| Recommendation | SELL STOP |
| Entry Point | 0.8540 |
| Take Profit | 0.8422, 0.8360 |
| Stop Loss | 0.8660 |
| Key Levels | 0.8360, 0.8422, 0.8544, 0.8789, 0.8911, 0.9033, 0.9155 |
| Alternative scenario | |
|---|---|
| Recommendation | BUY STOP |
| Entry Point | 0.8790 |
| Take Profit | 0.8911, 0.9033, 0.9155 |
| Stop Loss | 0.8710 |
| Key Levels | 0.8360, 0.8422, 0.8544, 0.8789, 0.8911, 0.9033, 0.9155 |
Current trend
The USD/CHF pair has been actively declining since the beginning of this month, trading around 0.8600.
After the publication of June statistics on the US labor market, which showed a significant slowdown in employment growth, and inflation data that confirmed its decline, the US currency began to actively lose ground. Experts believe that the sufficient effect of the increase in the interest rate of the US Fed has already been achieved, and in the second half of the year the regulator will move to keep the value at the current level. The monetary authorities expect two more increases in the cost of borrowing, but also confirm some progress in the fight against rising consumer prices.
In turn, the Swiss economy currently looks quite confident, supporting the national currency: the country's gross domestic product (GDP) grew by 0.3% in Q1 instead of the expected 0.1%, and the indicator added 0.6% year-on-year. At the same time, the consumer price index in June fell below the target mark, to 1.7% year-on-year, and the producer price index – to -0.6%. The USD/CHF pair may continue its downward trend in the mid-term.
Support and resistance
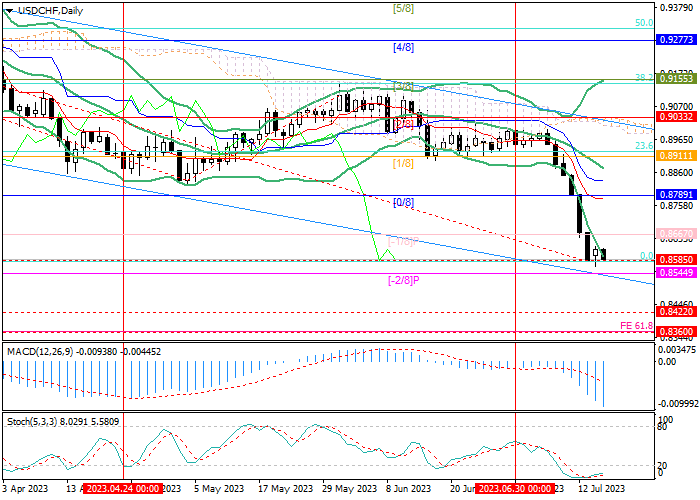
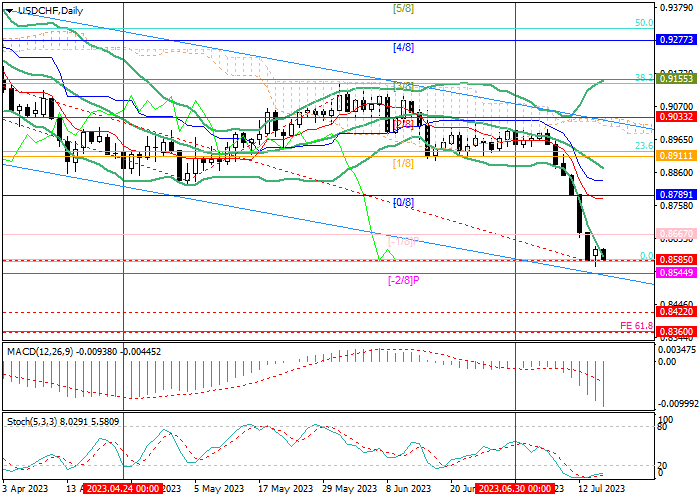
The instrument continues to trade within the descending channel and in the near future may continue to decline along its lower border to 0.8422 (Murray level [-2/8], H4) and 0.8360 (Fibonacci retracement 61.8%). The key for the "bulls" is the level 0.8789 (Murray level [0/8]), the breakout of which will ensure the continuation of price growth to the levels 0.8911 (Murray level [1/8], Fibonacci retracement 23.6%), 0.9033 (Murray level [2/8]) and 0.9155 (Murray level [3/8], Fibonacci retracement 38.2%).
Technical indicators point out the continuation of the downward trend: the Bollinger Bands are directed downwards, the MACD is increasing in the negative zone, and the Stochastic is in the oversold zone, but it is directed horizontally.
Resistance levels: 0.8789, 0.8911, 0.9033, 0.9155.
Support levels: 0.8544, 0.8422, 0.8360.
Trading tips
Short positions can be opened below 0.8544 with targets at 0.8422, 0.8360 and stop-loss at 0.8660. Implementation period: 5-7 days.
Long positions can be opened above 0.8789 with targets at 0.8911, 0.9033, 0.9155 and stop-loss at 0.8710.
คำชี้แจง (Disclaimer) : เนื้อหาข้างต้นเป็นเพียงมุมมองของผู้เขียนแต่เพียงผู้เดียว และไม่ได้แสดงหรือสะท้อนถึงจุดยืนอย่างเป็นทางการของ Followme แต่อย่างใด Followme ไม่รับผิดชอบต่อความถูกต้อง ความครบถ้วน หรือความน่าเชื่อถือของข้อมูลที่ปรากฏ และจะไม่รับผิดชอบต่อการดำเนินการใด ๆ ที่เกิดขึ้นจากเนื้อหานั้น เว้นแต่จะมีการระบุไว้เป็นลายลักษณ์อักษรอย่างชัดเจน

