


Hello everyone. In today’s article, we will look at the past performance of the 1 Hour Elliott Wave chart of Tesla Inc. ($TSLA) The rally from 4.27.2023 low unfolded as a 5 wave impulse with an incomplete bullish sequence from 6.26.2023 low. So, we advised members to buy the pullback in 7 swings (WXY) at the blue box area ($269.45 – 262.39). We will explain the structure & forecast below:
$TSLA 1H Elliott Wave Chart 7.10.2023:
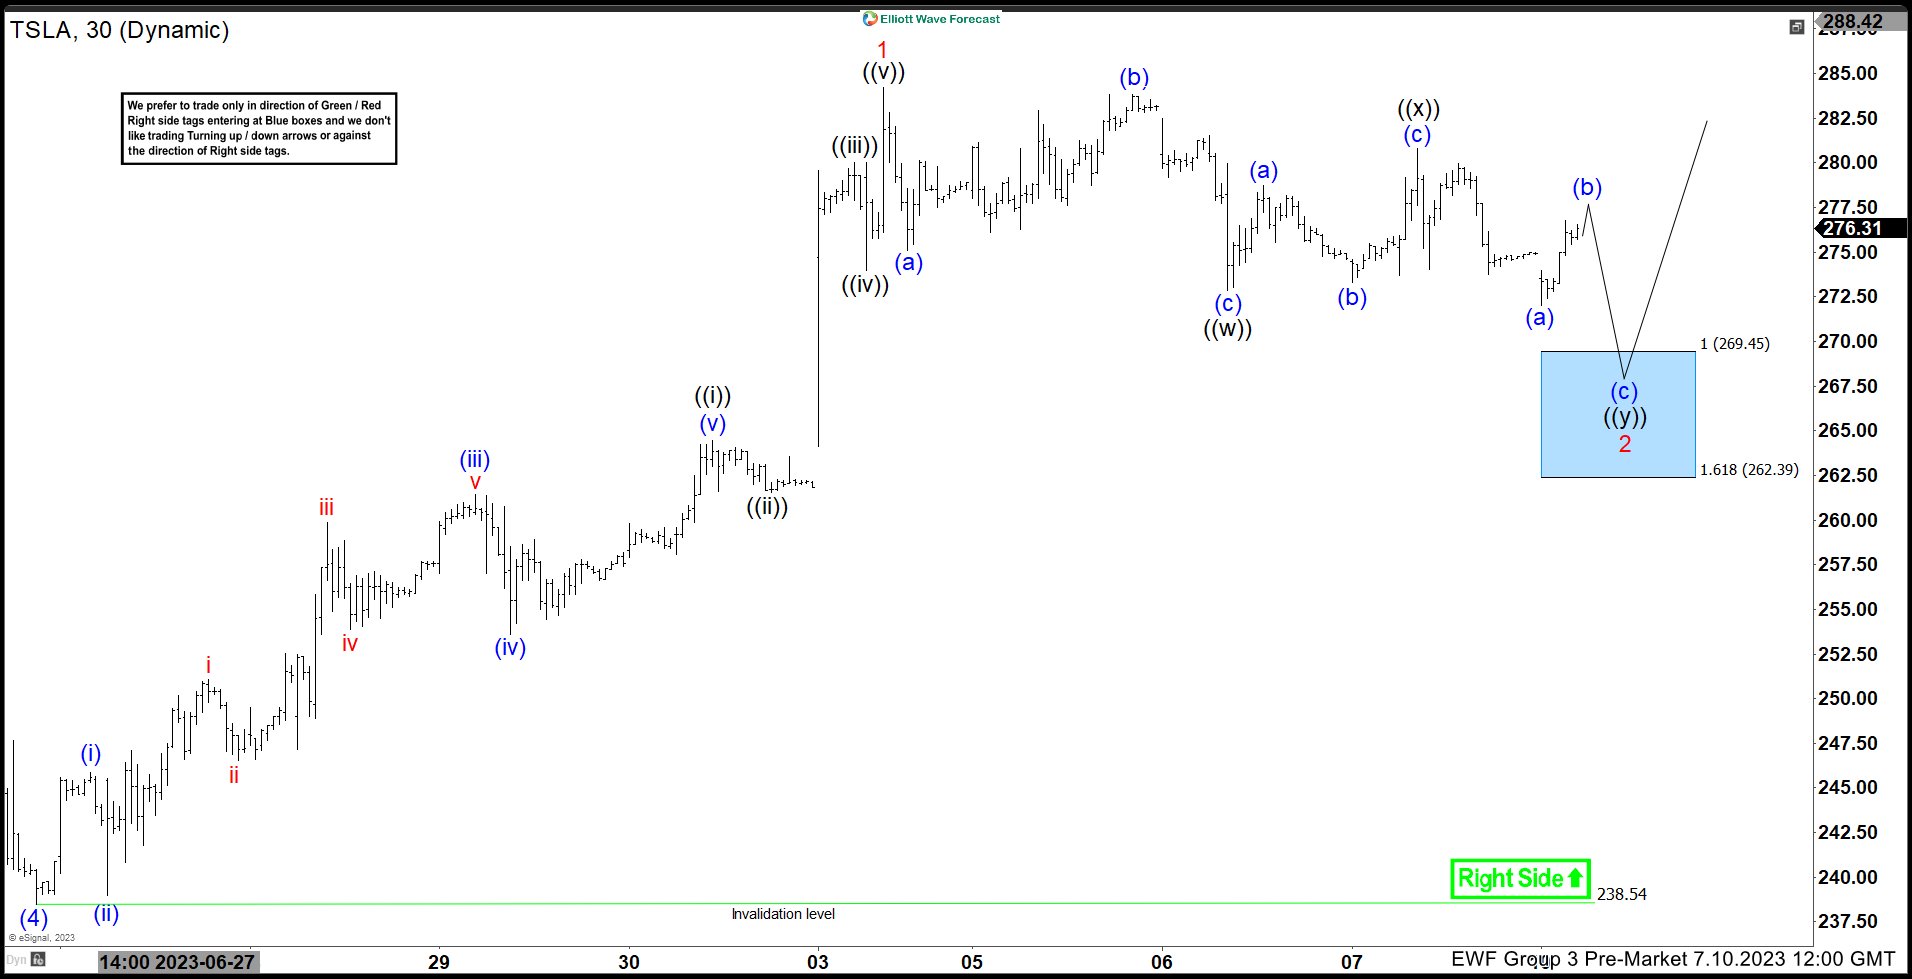 Here is the 1H Elliott Wave count from 7.10.2023. The rally from 6.26.2023 low at blue (4) unfolded in a 5 wave impulse which signaled a bullish trend. We expected the pullback to find buyers in 7 swings at $269.45 – 262.39 where we entered as buyers.
$TSLA 1H Elliott Wave Chart 7.16.2023:
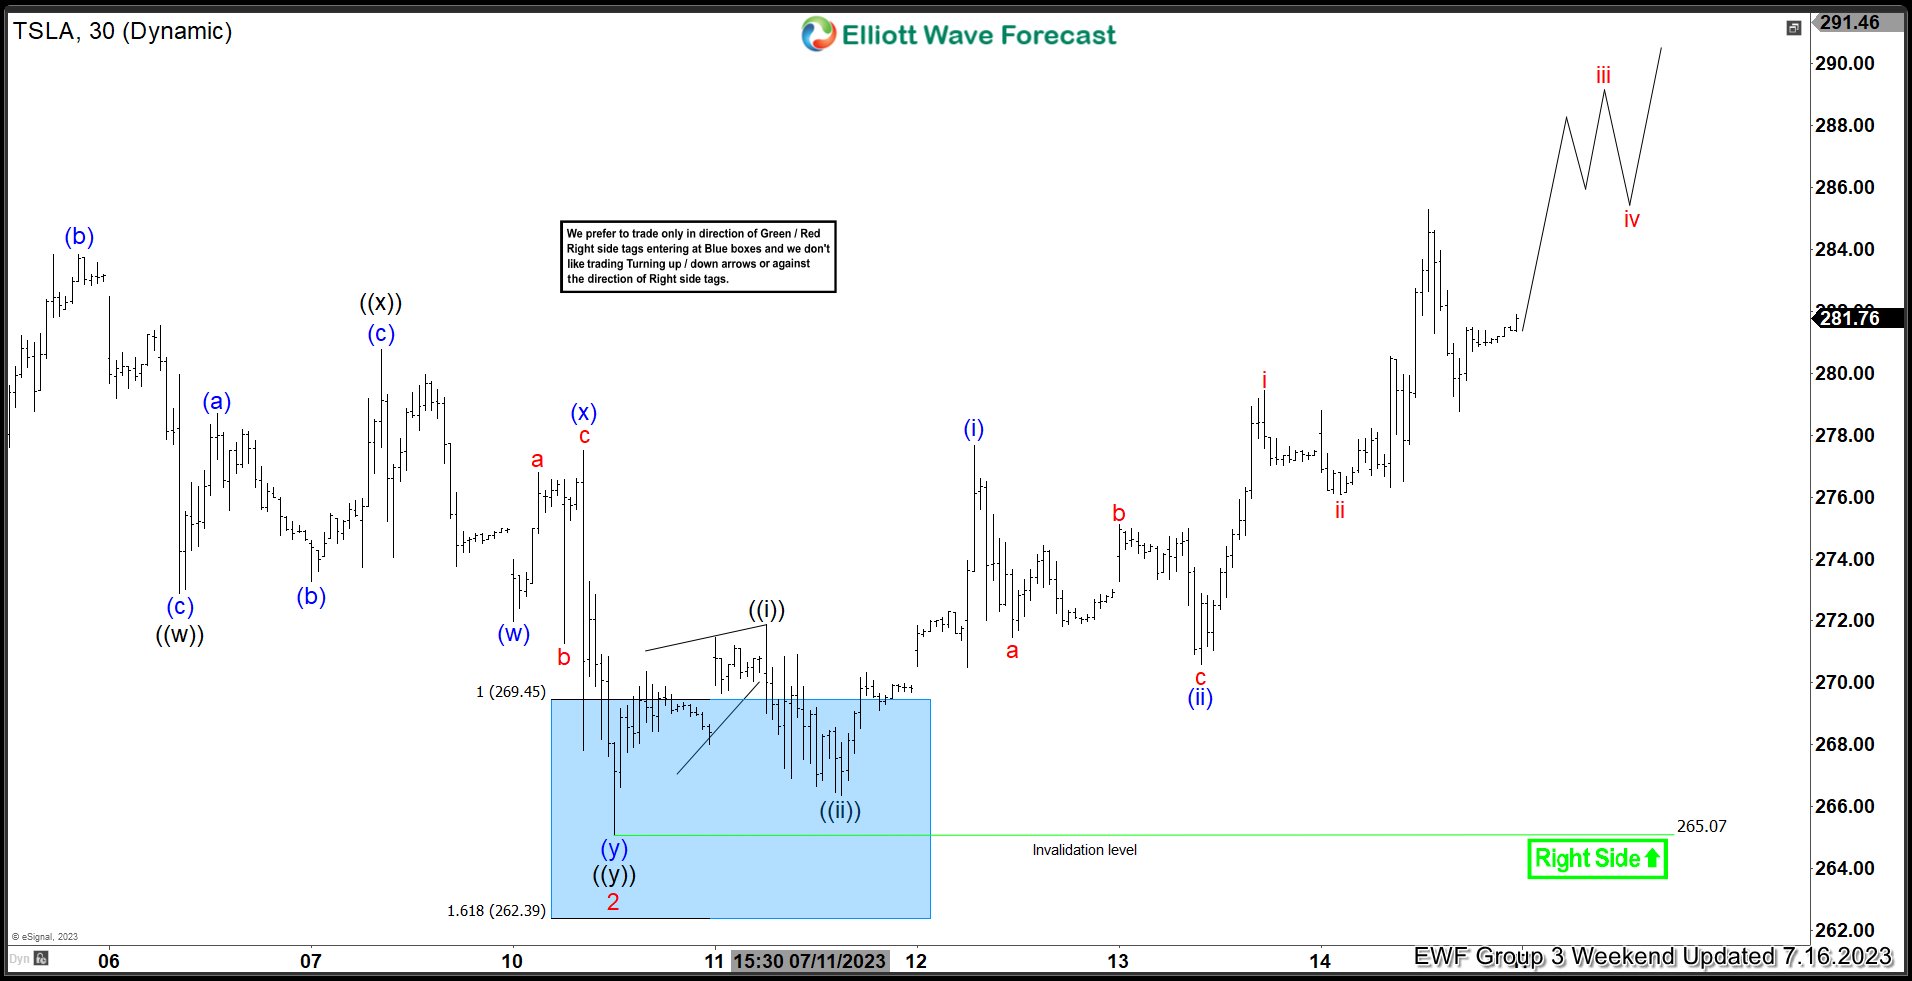 Here is the latest 1H weekend update showing the move taking place as expected. The stock has reacted higher from the blue box area allowing longs to get a risk free position and breaking above 7.03.2023 peak creating another bullish sequence. From here, we expect more upside towards $311 – 340 area in the near term and eventually a new all time high.
คำชี้แจง (Disclaimer) : เนื้อหาข้างต้นเป็นเพียงมุมมองของผู้เขียนแต่เพียงผู้เดียว และไม่ได้แสดงหรือสะท้อนถึงจุดยืนอย่างเป็นทางการของ Followme แต่อย่างใด Followme ไม่รับผิดชอบต่อความถูกต้อง ความครบถ้วน หรือความน่าเชื่อถือของข้อมูลที่ปรากฏ และจะไม่รับผิดชอบต่อการดำเนินการใด ๆ ที่เกิดขึ้นจากเนื้อหานั้น เว้นแต่จะมีการระบุไว้เป็นลายลักษณ์อักษรอย่างชัดเจน

