


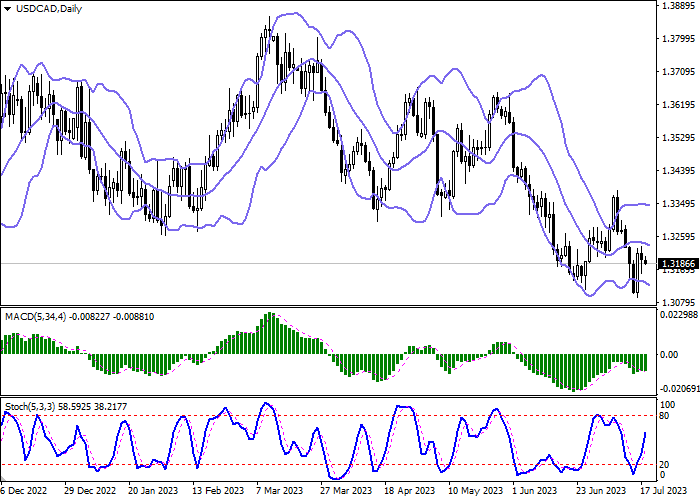
| Scenario | |
|---|---|
| Timeframe | Intraday |
| Recommendation | SELL STOP |
| Entry Point | 1.3145 |
| Take Profit | 1.3050 |
| Stop Loss | 1.3200 |
| Key Levels | 1.3000, 1.3050, 1.3100, 1.3150, 1.3200, 1.3250, 1.3300, 1.3350 |
| Alternative scenario | |
|---|---|
| Recommendation | BUY STOP |
| Entry Point | 1.3205 |
| Take Profit | 1.3300 |
| Stop Loss | 1.3150 |
| Key Levels | 1.3000, 1.3050, 1.3100, 1.3150, 1.3200, 1.3250, 1.3300, 1.3350 |
Current trend
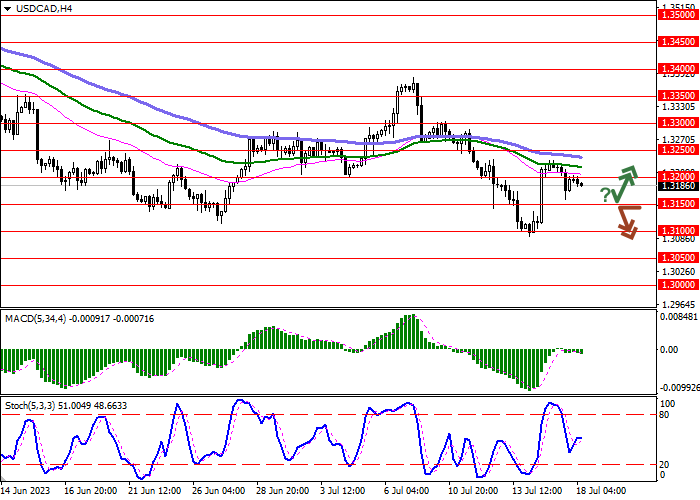
The USD/CAD pair shows an uncertain decline, developing a weak "bearish" momentum formed at the beginning of the week. The instrument is testing 1.3185 for a breakdown, waiting for new drivers to appear on the market.
The pressure on the positions of the US currency is exerted by the expectations of the imminent completion of the current cycle of tightening monetary policy by the US Federal Reserve. Analysts are convinced in another 25 basis points increase in interest rates next week, after which the regulator is likely to take a wait-and-see attitude and refuse to further tighten monetary conditions until the end of the year. It is assumed that at the beginning of 2024, the Fed may return to adjusting the cost of borrowing as inflation decreases, which is already quite close to the target levels of the US Federal Reserve.
The Canadian dollar, in turn, maintains momentum after another tightening of monetary policy by the Bank of Canada last week: the interest rate was raised by 25 basis points to 5.00%, which coincided with most forecasts. In an accompanying statement, the regulator's representatives noted the continuing risks of a slowdown in the global economy, as well as fairly high growth rates in consumer prices. Officials also did not rule out a possible increase in the cost of borrowing in the future, if the situation requires it.
Today, the focus of investors will be the June statistics on inflation in Canada. Forecasts suggest a slowdown in the annual Consumer Price Index from 3.4% to 3.0%, and in monthly terms, the figure may decrease from 0.4% to 0.3%.
Support and resistance
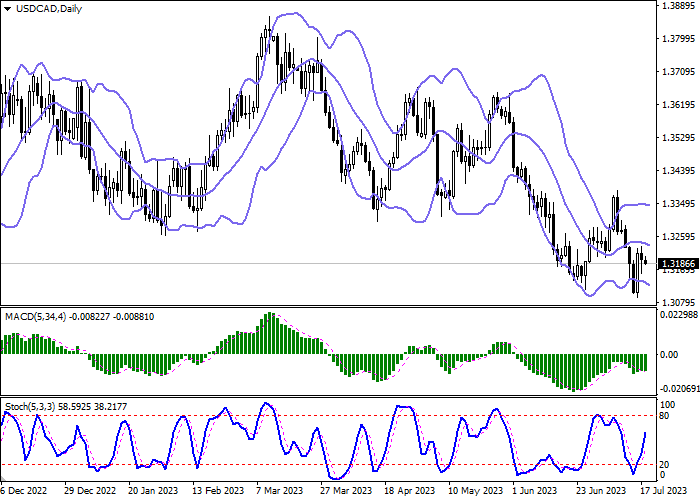
Bollinger Bands in D1 chart demonstrate a moderate decrease. The price range is slightly expanded from below, remaining spacious enough for the current activity level in the market. MACD, which reversed upwards at the end of the last week, still maintains an upward direction and a weak buy signal (the histogram is above the signal line). Stochastic shows more confident growth, practically not reacting to the resumption of decline at the beginning of the week.
Resistance levels: 1.3200, 1.3250, 1.3300, 1.3350.
Support levels: 1.3150, 1.3100, 1.3050, 1.3000.
Trading tips
Short positions may be opened after a breakdown of 1.3150 with the target at 1.3050. Stop-loss — 1.3200. Implementation time: 1-2 days.
A rebound from 1.3150 as from support followed by a breakout of 1.3200 may become a signal for opening new long positions with the target at 1.3300. Stop-loss — 1.3150.
คำชี้แจง (Disclaimer) : เนื้อหาข้างต้นเป็นเพียงมุมมองของผู้เขียนแต่เพียงผู้เดียว และไม่ได้แสดงหรือสะท้อนถึงจุดยืนอย่างเป็นทางการของ Followme แต่อย่างใด Followme ไม่รับผิดชอบต่อความถูกต้อง ความครบถ้วน หรือความน่าเชื่อถือของข้อมูลที่ปรากฏ และจะไม่รับผิดชอบต่อการดำเนินการใด ๆ ที่เกิดขึ้นจากเนื้อหานั้น เว้นแต่จะมีการระบุไว้เป็นลายลักษณ์อักษรอย่างชัดเจน

