


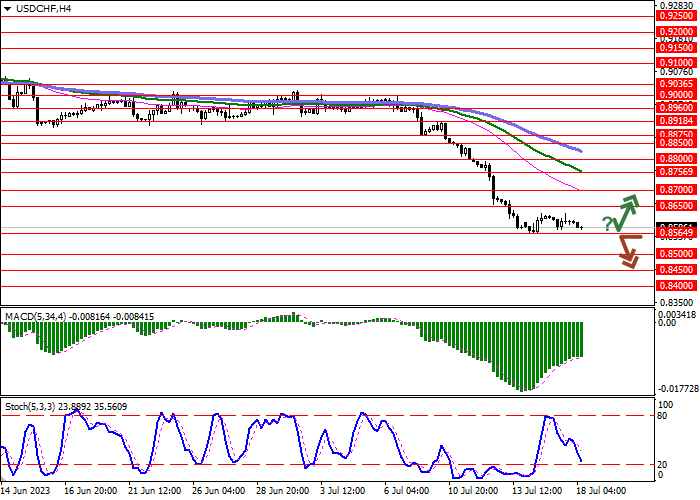
| Scenario | |
|---|---|
| Timeframe | Intraday |
| Recommendation | SELL STOP |
| Entry Point | 0.8560 |
| Take Profit | 0.8400 |
| Stop Loss | 0.8650 |
| Key Levels | 0.8400, 0.8450, 0.8500, 0.8564, 0.8650, 0.8700, 0.8756, 0.8800 |
| Alternative scenario | |
|---|---|
| Recommendation | BUY STOP |
| Entry Point | 0.8655 |
| Take Profit | 0.8800 |
| Stop Loss | 0.8564 |
| Key Levels | 0.8400, 0.8450, 0.8500, 0.8564, 0.8650, 0.8700, 0.8756, 0.8800 |
Current trend
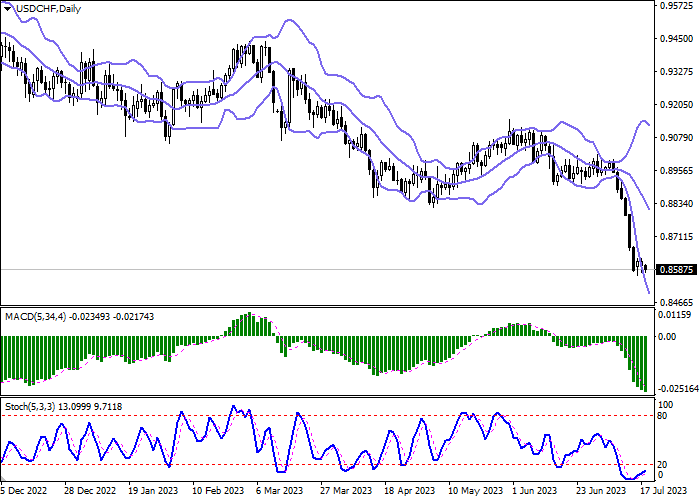
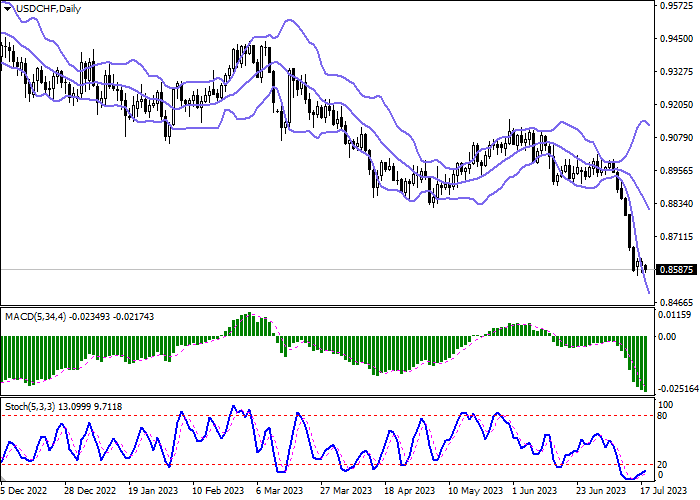
The USD/CHF pair again shows an active downward trend, testing the level of 0.8580 for a breakdown.
After a short and uncertain growth at the end of last week, the US currency again returned to the decline, remaining under pressure from the expectations of the completion of the current cycle of tightening of the US Federal Reserve's monetary policy. At the same time, it is worth noting that at the moment more than 96.0% of analysts still expect the interest rate to rise by 25 basis points to 5.50% next week. After that, the regulator is likely to try to take a wait-and-see attitude and be ready to return to adjusting the cost of borrowing either at the end of this year or at the beginning of the next one.
Investors are focused on macroeconomic statistics from the USA today. Forecasts suggest acceleration in Retail Sales in June from 0.3% to 0.5%, while Industrial Production may decline by 0.1% after falling by 0.2% in the previous month.
On Thursday, Switzerland will publish June data on exports and imports: a moderate decline in Exports is expected, which could lead to a reduction in the Swiss trade surplus from 5479.0 million Swiss francs to 4031.0 million Swiss francs.
Support and resistance
Bollinger Bands on the daily chart show a steady decline. The price range expands from below, making way for new local lows for the "bears". MACD is going down preserving a stable sell signal (located below the signal line). Stochastic, being in the oversold area, is trying to reverse upwards, which can be interpreted as a potential formation of corrective growth in the ultra-short term.
Resistance levels: 0.8650, 0.8700, 0.8756, 0.8800.
Support levels: 0.8564, 0.8500, 0.8450, 0.8400.
Trading tips
Short positions may be opened after a breakdown of 0.8564 with the target at 0.8400. Stop-loss — 0.8650. Implementation time: 2-3 days.
A rebound from the level of 0.8564 as a support, followed by a breakout of 0.8650, may become a signal to open new long positions with the target at 0.8800. Stop-loss — 0.8564.
คำชี้แจง (Disclaimer) : เนื้อหาข้างต้นเป็นเพียงมุมมองของผู้เขียนแต่เพียงผู้เดียว และไม่ได้แสดงหรือสะท้อนถึงจุดยืนอย่างเป็นทางการของ Followme แต่อย่างใด Followme ไม่รับผิดชอบต่อความถูกต้อง ความครบถ้วน หรือความน่าเชื่อถือของข้อมูลที่ปรากฏ และจะไม่รับผิดชอบต่อการดำเนินการใด ๆ ที่เกิดขึ้นจากเนื้อหานั้น เว้นแต่จะมีการระบุไว้เป็นลายลักษณ์อักษรอย่างชัดเจน

