


| Scenario | |
|---|---|
| Timeframe | Weekly |
| Recommendation | SELL STOP |
| Entry Point | 7200.5 |
| Take Profit | 6950.0 |
| Stop Loss | 7300.0 |
| Key Levels | 6950.0, 7200.0, 7370.0, 7590.0 |
| Alternative scenario | |
|---|---|
| Recommendation | BUY STOP |
| Entry Point | 7370.5 |
| Take Profit | 7590.0 |
| Stop Loss | 7250.0 |
| Key Levels | 6950.0, 7200.0, 7370.0, 7590.0 |
Current trend
One of the leading indexes of the European economy CAC 40 shows a correction at 7290.0, which is connected with expectations regarding tomorrow's publication of June statistics on the Consumer Price Index in the euro area. Analysts suggest that the index will slow down from 6.1% to 5.5%, but Core CPI may correct from 5.3% to 5.4%. This forecast does not allow investors to hope for a slowdown in interest rate hikes at the upcoming meeting of the European Central Bank (ECB).
On the bond market yesterday, auctions were held to place French short-term bills with maturities of 3, 6 and 12 months, the yield rates for which were: 3.584%, 3.671% and 3.759% after 3.556%, 3.670% and 3.760% at the previous placement. The almost same value of the yields indicates the continuing uncertainty in the market. Judging by the latest statements, the European regulator does not plan to start reducing the cost of borrowing, so one should not expect negative dynamics in the bond market either, and the pressure on the stock index will continue.
The growth leaders in the index are Carrefour SA ( 0.58%), Sanofi SA ( 0.49%), Thales SA ( 0.47%).
Among the leaders of the decline are Hermes International SCA (-4.21%), LVMH Moet Hennessy Louis Vuitton SE (-3.73%), Kering SA (-1.95%), L’Oreal SA (-1.81%).
Support and resistance
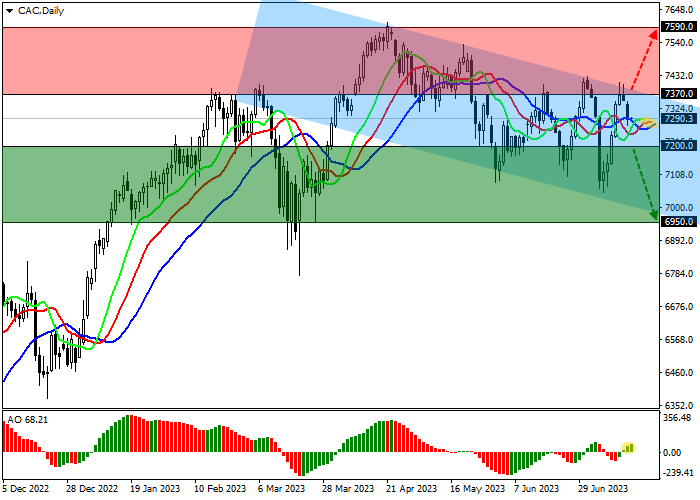
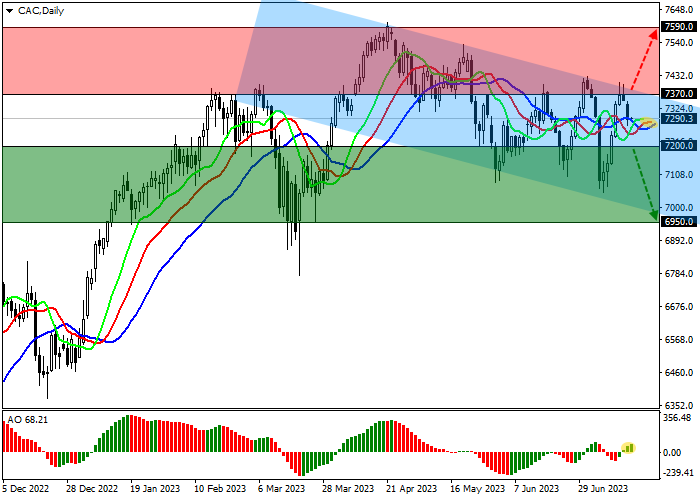
On the daily chart, the quotes failed to consolidate above the resistance line of the global descending channel with dynamic boundaries 7370.0–6950.0 and may continue their downward reversal.
Technical indicators have reversed and are ready to issue a new sell signal: fast EMAs on the Alligator indicator are approaching the signal line, and the AO histogram is forming new corrective bars being in the buy zone.
Support levels: 7200.0, 6950.0.
Resistance levels: 7370.0, 7590.0.
Trading tips
If the asset reverses and contiues declining and the price consolidates below the local support level of 7200.0, short positions can be opened with the target at 6950.0. Stop-loss — 7300.0. Implementation time: 7 days and more.
If the asset reverses and continues growing, and the price consolidates above the local resistance at 7370.0, long positions with a target of 7590.0 and stop-loss of 7250.0 will be relevant.
คำชี้แจง (Disclaimer) : เนื้อหาข้างต้นเป็นเพียงมุมมองของผู้เขียนแต่เพียงผู้เดียว และไม่ได้แสดงหรือสะท้อนถึงจุดยืนอย่างเป็นทางการของ Followme แต่อย่างใด Followme ไม่รับผิดชอบต่อความถูกต้อง ความครบถ้วน หรือความน่าเชื่อถือของข้อมูลที่ปรากฏ และจะไม่รับผิดชอบต่อการดำเนินการใด ๆ ที่เกิดขึ้นจากเนื้อหานั้น เว้นแต่จะมีการระบุไว้เป็นลายลักษณ์อักษรอย่างชัดเจน

