


| Scenario | |
|---|---|
| Timeframe | Weekly |
| Recommendation | BUY STOP |
| Entry Point | 542.05 |
| Take Profit | 580.00 |
| Stop Loss | 530.00 |
| Key Levels | 472.00, 518.00, 542.05, 580.00 |
| Alternative scenario | |
|---|---|
| Recommendation | SELL STOP |
| Entry Point | 517.95 |
| Take Profit | 472.00 |
| Stop Loss | 530.00 |
| Key Levels | 472.00, 518.00, 542.05, 580.00 |
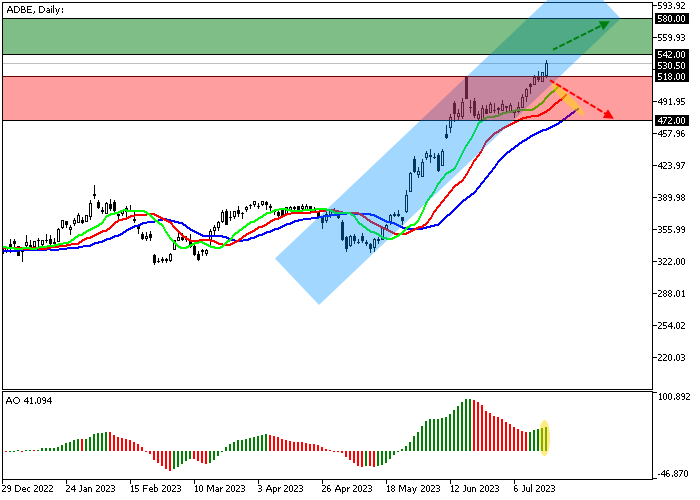
Shares of Adobe Inc., a leading US software developer, are trading at 530.00, within an uptrend.
On the daily chart, the price rises from the support line of the local rising channel with dynamic boundaries of 580.00–510.00.
On the four-hour chart, the quotes consolidated above the key local high of 518.00, which may mean that the upward potential will remain until the corridor resistance line at 580.00 is reached.
Technical indicators actively strengthen the positive signal: the range of fluctuations of the EMA on the Alligator indicator rapidly expands, and the AO histogram forms rising bars in the buying zone.
Trading tips
Long positions may be opened after the price rises and consolidates above 542.00 with the target at 580.00. Stop loss – 530.00. Implementation period: 7 days or more.
Short positions may be opened after a reversal, reduction, and consolidation of the price below 518.00 with the target at 472.00. Stop loss – 530.00.
คำชี้แจง (Disclaimer) : เนื้อหาข้างต้นเป็นเพียงมุมมองของผู้เขียนแต่เพียงผู้เดียว และไม่ได้แสดงหรือสะท้อนถึงจุดยืนอย่างเป็นทางการของ Followme แต่อย่างใด Followme ไม่รับผิดชอบต่อความถูกต้อง ความครบถ้วน หรือความน่าเชื่อถือของข้อมูลที่ปรากฏ และจะไม่รับผิดชอบต่อการดำเนินการใด ๆ ที่เกิดขึ้นจากเนื้อหานั้น เว้นแต่จะมีการระบุไว้เป็นลายลักษณ์อักษรอย่างชัดเจน

