


| Scenario | |
|---|---|
| Timeframe | Weekly |
| Recommendation | BUY STOP |
| Entry Point | 77.05 |
| Take Profit | 81.00 |
| Stop Loss | 75.00 |
| Key Levels | 68.10, 73.50, 77.00, 81.00 |
| Alternative scenario | |
|---|---|
| Recommendation | SELL STOP |
| Entry Point | 73.45 |
| Take Profit | 68.10 |
| Stop Loss | 75.00 |
| Key Levels | 68.10, 73.50, 77.00, 81.00 |
Current trend
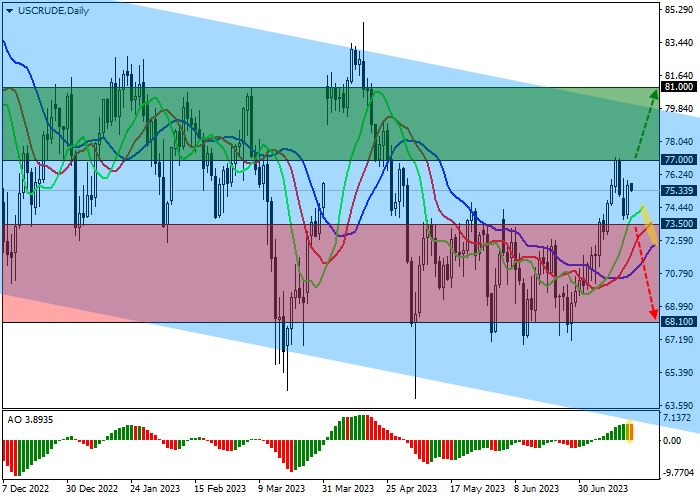
The price of North American WTI Crude Oil is correcting within a sideways trend around 75.33.
Investors focus on Russia’s shipping volumes, which, according to the latest Bloomberg report, have begun to decline within an agreement adopted in March to voluntarily cut oil production by 0.50M barrels per day, which is by 0.27M barrels per day lower than the February low of 3.10M barrels per day. The changes primarily affected supplies to Asia, which reached 2.77M barrels per day, and to India, which now receives 1.75M barrels per day. The slowdown in exports after almost six months of continuous growth supported oil quotes: investors expect that the full implementation of the agreements by all members of OPEC will serve as a signal for a gradual increase in acceptable production levels at the next meetings of the cartel.
This week, US oil inventories continued their negative dynamics: according to the American Petroleum Institute (API), the indicator corrected to –0.797M barrels, slightly lower than expected –2.250M barrels. The Energy Information Administration of the US Department of Energy (EIA) may report a change in stocks of –2.440M barrels after rising by 5.946M earlier, which indicates a further release of oil by the state from the strategic reserve in an attempt to compensate for the reduction in OPEC production but considering a decrease in exports from the Russian Federation, it will not be enough.
Support and resistance
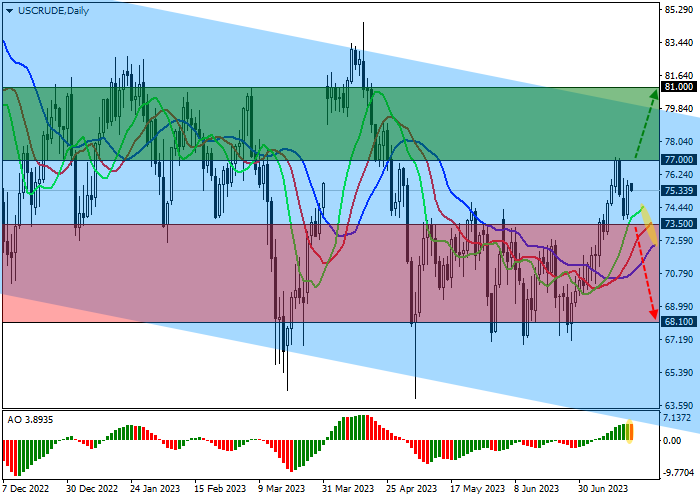
On the daily chart, the trading instrument is growing within the global channel with dynamic boundaries 62.50–79.80 in the direction of the resistance line.
Technical indicators maintain a stable buy signal, with fast Alligator EMAs oscillation range grows, and the AO histogram forming upward bars, rising in the buying zone.
Resistance levels: 77.00, 81.00.
Support levels: 73.50, 68.10.
Trading tips
Long positions may be opened after the price rises and consolidates above 77.00 with the target at 81.00. Stop loss — 75.00. Implementation period: 7 days or more.
Short positions may be opened after the price drops and consolidates below 73.50 with the target at 68.10. Stop loss — 75.00.
คำชี้แจง (Disclaimer) : เนื้อหาข้างต้นเป็นเพียงมุมมองของผู้เขียนแต่เพียงผู้เดียว และไม่ได้แสดงหรือสะท้อนถึงจุดยืนอย่างเป็นทางการของ Followme แต่อย่างใด Followme ไม่รับผิดชอบต่อความถูกต้อง ความครบถ้วน หรือความน่าเชื่อถือของข้อมูลที่ปรากฏ และจะไม่รับผิดชอบต่อการดำเนินการใด ๆ ที่เกิดขึ้นจากเนื้อหานั้น เว้นแต่จะมีการระบุไว้เป็นลายลักษณ์อักษรอย่างชัดเจน

