Current trend
The USD/JPY pair is declining, retreating from the local highs of July 12, updated the day before. The instrument is testing the level of 139.20 for a breakdown, reacting to the publication of statistics on the US housing market, which reflected a drop in the dynamics of Building Permits by 3.7%, as well as an overall slowdown in the Housing Starts by 8.0%. At the same time, in the previous month, both indicators showed a steady growth of 5.6% and 15.7%, respectively.
The yen is supported by the Japanese macroeconomic data. Exports in June rose by 1.5% after 0.6% in the previous month, while analysts expected a more confident growth of 2.2%, while Imports decreased by 12.9% after -9.8% in May with forecast at the level of -11.3%. Merchandise Trade Balance Total widened to 43.0 billion yen, while analysts had expected the deficit to decline from -1381.9 billion yen to -46.7 billion yen.
Tomorrow, investors will evaluate the June statistics on inflation in Japan. Forecasts suggest that the Consumer Price Index will accelerate from 3.2% to 3.5%, while the CPI excluding Food and Energy may correct from 4.3% to 4.2%.
Support and resistance
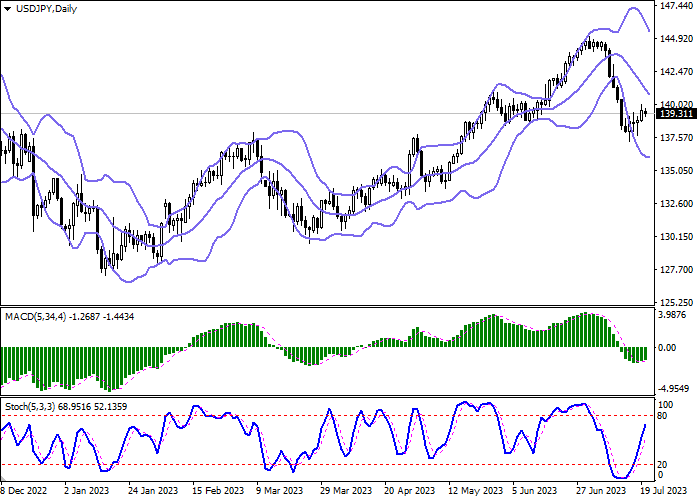
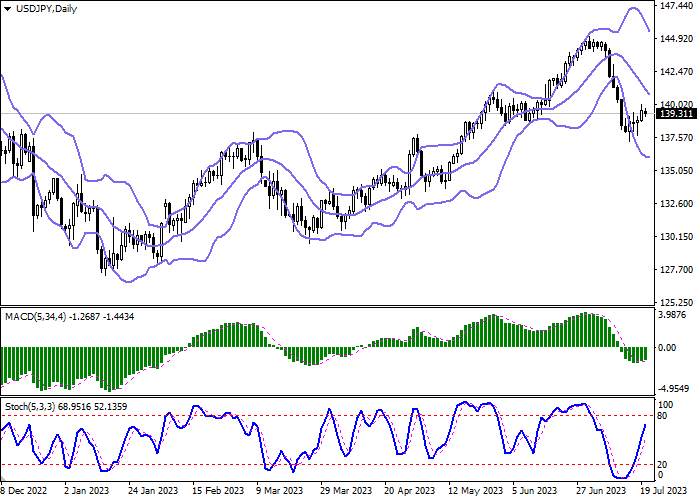
Bollinger Bands on the daily chart show a steady decline. The price range is slightly narrowing from below, reflecting the attempt at correctional growth in the short term. MACD has reversed to growth having formed a new buy signal (located above the signal line). Stochastic grows more steadily rapidly approaching its highs, which reflects risks of the overbought dollar in the ultra-short term.
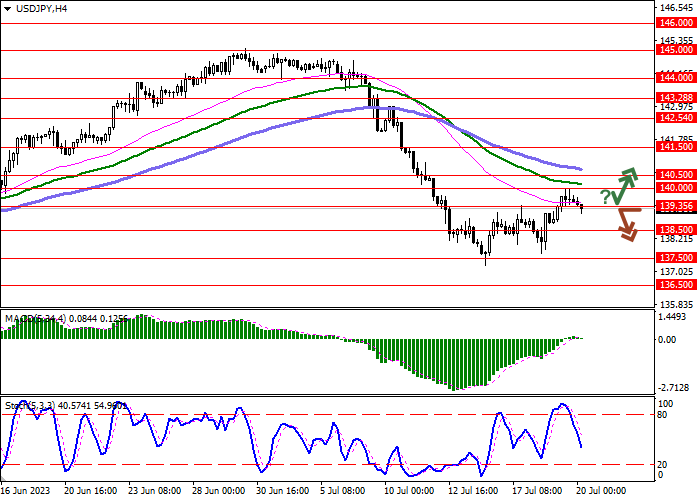
Resistance levels: 140.00, 140.50, 141.50, 142.54.
Support levels: 139.35, 138.50, 137.50, 136.50.
Trading tips
Short positions may be opened after a breakdown of 139.35 with the target at 137.50. Stop-loss — 140.50. Implementation time: 1-2 days.
A rebound from 139.35 as from support followed by a breakout of 140.00 may become a signal for opening new long positions with the target at 141.50. Stop-loss — 139.00.