


| Scenario | |
|---|---|
| Timeframe | Weekly |
| Recommendation | BUY STOP |
| Entry Point | 34.55 |
| Take Profit | 37.00 |
| Stop Loss | 33.50 |
| Key Levels | 29.00, 32.10, 34.55, 37.00 |
| Alternative scenario | |
|---|---|
| Recommendation | SELL STOP |
| Entry Point | 32.05 |
| Take Profit | 29.00 |
| Stop Loss | 33.00 |
| Key Levels | 29.00, 32.10, 34.55, 37.00 |
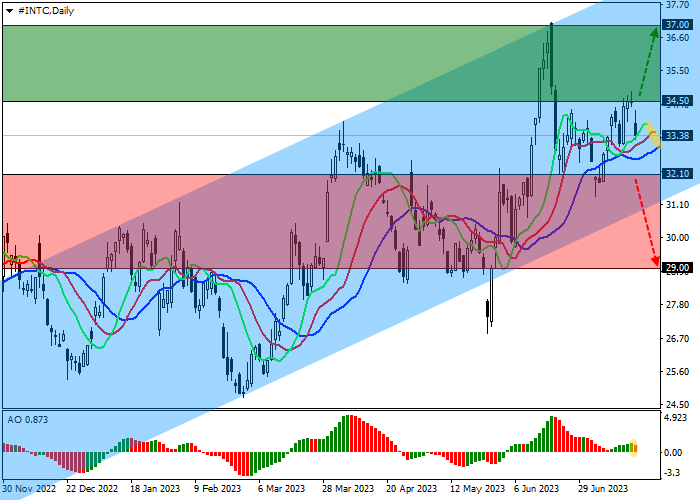
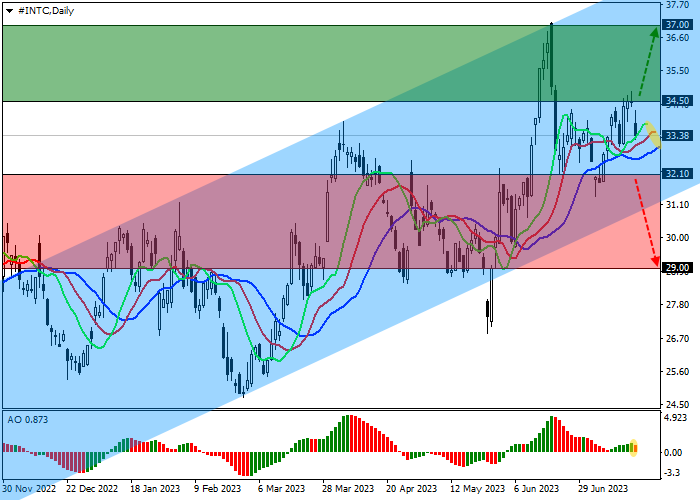
Shares of Intel Corp., a global giant in the development and sale of electronic devices and computer components, are moving within a corrective trend at 33.00.
On the daily chart, the price reversed near the support line of the ascending corridor with dynamic boundaries at 31.00–38.00 and is heading up.
On the four-hour chart, it can be seen that the volatility of trading in the asset has recently increased, as evidenced by multiple price gaps, most of which are directed upwards. The key “bullish” level the local resistance 35.00, after consolidation above which there will be no other obstacles for growth to the resistance level of 38.00.
Technical indicators maintain a stable upward signal, not excluding a correction: the EMA fluctuation range on the Alligator indicator is expanding, and the AO histogram is forming correctional bars, rising in the buying zone.
Trading tips
Long positions may be opened after the price rises and consolidates above 34.50 with the target at 37.00. Stop loss — 33.50. Implementation period: 7 days or more.
Short positions may be opened after the price reverses, falls and consolidates below 32.10 with the target at 29.00 and stop loss 33.00.
คำชี้แจง (Disclaimer) : เนื้อหาข้างต้นเป็นเพียงมุมมองของผู้เขียนแต่เพียงผู้เดียว และไม่ได้แสดงหรือสะท้อนถึงจุดยืนอย่างเป็นทางการของ Followme แต่อย่างใด Followme ไม่รับผิดชอบต่อความถูกต้อง ความครบถ้วน หรือความน่าเชื่อถือของข้อมูลที่ปรากฏ และจะไม่รับผิดชอบต่อการดำเนินการใด ๆ ที่เกิดขึ้นจากเนื้อหานั้น เว้นแต่จะมีการระบุไว้เป็นลายลักษณ์อักษรอย่างชัดเจน

