


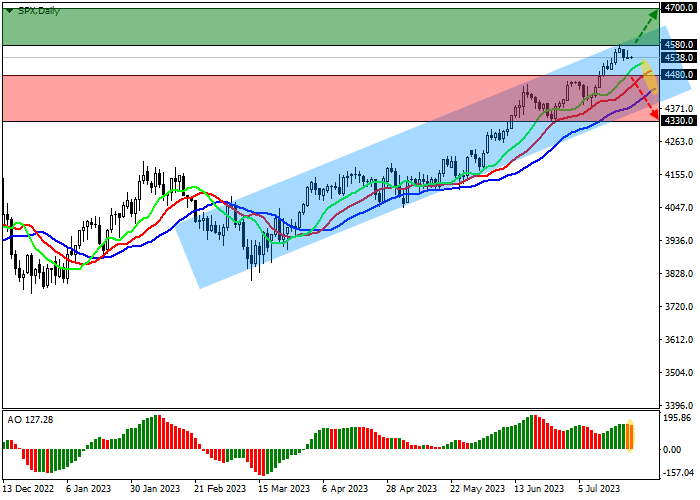
| Scenario | |
|---|---|
| Timeframe | Weekly |
| Recommendation | BUY STOP |
| Entry Point | 4580.0 |
| Take Profit | 4700.0 |
| Stop Loss | 4500.0 |
| Key Levels | 4330.0, 4480.0, 4580.0, 4700.0 |
| Alternative scenario | |
|---|---|
| Recommendation | SELL STOP |
| Entry Point | 4480.0 |
| Take Profit | 4330.0 |
| Stop Loss | 4550.0 |
| Key Levels | 4330.0, 4480.0, 4580.0, 4700.0 |
Current trend
The leading US economy index S&P 500 is correcting at around 4538.0. This week, the dynamics of US stock markets will directly depend on corporate reports, the publication of which has entered the main phase.
At the end of last week, financial data was presented by the payment system American Express Co. and oil giant Chevron Corp. Despite the fact that the revenue of American Express Co. was below analysts' expectations of 15.41 billion dollars, amounting to 15.05 billion dollars, earnings per share rose to 2.89 dollars, surpassing preliminary estimates of 2.81 dollars. In turn, Chevron Corp. recorded revenue of 48.4 billion dollars, as well as earnings per share of up to 3.08 dollars against a forecast of 2.98 dollars. Tomorrow, such market giants as Microsoft Corp., Alphabet Inc., Visa Inc., Verizon Inc., General Electric Co. and 3M Co. will present their results.
At the moment, the growth leaders in the index are Zoetis Inc. ( 6.93%), Danaher Inc. ( 4.98%), Thermo Fisher Scientific Inc. ( 4.44%), Bio-Rad Labs Inc. ( 4.01%).
Among the leaders of the decline are Interpublic Group of Companies Inc. (-13.32%), Omnicom Group Inc. (-4.95%), Zions Bancorporation (-4.72%).
Support and resistance
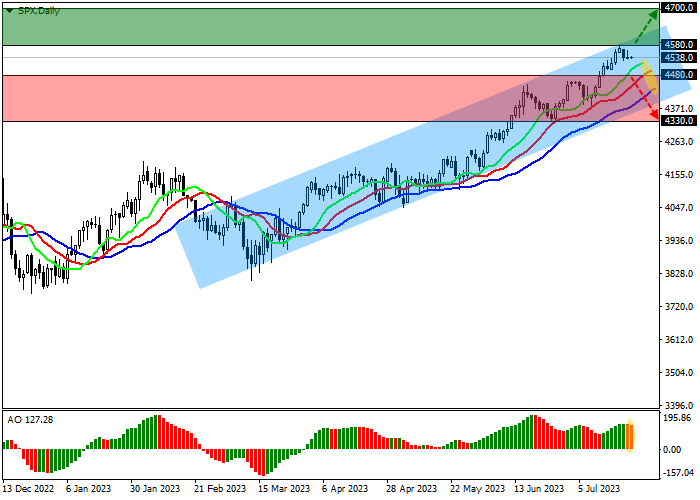
The index quotes continue the global trend and again approach the resistance line of the global ascending corridor with the borders of 4650.0–4400.0 on the daily chart.
Technical indicators hold a buy signal, which remains quite stable: the fast EMAs of the Alligator indicator are above the signal line, and the AO histogram, being in the buy zone, is forming correction bars.
Support levels: 4480.0, 4330.0.
Resistance levels: 4580.0, 4700.0.
Trading tips
If the asset continues growing locally and the price consolidates above the local resistance level of 4580.0, long positions will be relevant with target at 4700.0. Stop-loss — 4500.0. Implementation time: 7 days and more.
If the asset reverses and contiues declining and the price consolidates below the local support level of 4480.0, short positions can be opened with the target at 4330.0. Stop-loss — 4550.0.
คำชี้แจง (Disclaimer) : เนื้อหาข้างต้นเป็นเพียงมุมมองของผู้เขียนแต่เพียงผู้เดียว และไม่ได้แสดงหรือสะท้อนถึงจุดยืนอย่างเป็นทางการของ Followme แต่อย่างใด Followme ไม่รับผิดชอบต่อความถูกต้อง ความครบถ้วน หรือความน่าเชื่อถือของข้อมูลที่ปรากฏ และจะไม่รับผิดชอบต่อการดำเนินการใด ๆ ที่เกิดขึ้นจากเนื้อหานั้น เว้นแต่จะมีการระบุไว้เป็นลายลักษณ์อักษรอย่างชัดเจน

