


| Scenario | |
|---|---|
| Timeframe | Weekly |
| Recommendation | BUY STOP |
| Entry Point | 81.80 |
| Take Profit | 84.38, 87.50 |
| Stop Loss | 80.00 |
| Key Levels | 75.00, 78.12, 81.25, 84.38, 87.50 |
| Alternative scenario | |
|---|---|
| Recommendation | BUY LIMIT |
| Entry Point | 78.12 |
| Take Profit | 84.38, 87.50 |
| Stop Loss | 76.20 |
| Key Levels | 75.00, 78.12, 81.25, 84.38, 87.50 |
Current trend
Quotes of WTI Crude Oil began the week with a decline: from five-month highs of 83.40, they dropped to the level of 80.60.
Pressure on the instrument is exerted by a number of factors, the most important of which is the publication of weak July data on Chinese foreign trade: exports immediately decreased by 14.5% with a forecast of -12.5%, and imports – by -12.4% instead of the expected 5.0%. A serious deterioration in indicators raises concerns among bidders about a weaker recovery in China's economy after the coronavirus pandemic, which may negatively affect energy demand. In addition, the end of the summer car season in the USA will undoubtedly entail a significant reduction in fuel consumption.
Nevertheless, despite the serious short-term pressure on the market, the current correction is not a barrier to an uptrend, as long-term price support factors remain. Thus, the leading exporting countries are actively reducing production volumes within the framework of the OPEC agreement. This has already been stated by representatives of Saudi Arabia, noting that plans to adjust production by -1.0M barrels per day are extended until the end of September. In addition, investors are concerned about the escalation of the Russian-Ukrainian conflict, which may create an obstacle in the functioning of the Black Sea ports engaged in the export of significant volumes of "black gold".
All these factors confirm the continuation of the upward trend in the market and the imminent resumption of oil price growth.
Support and resistance
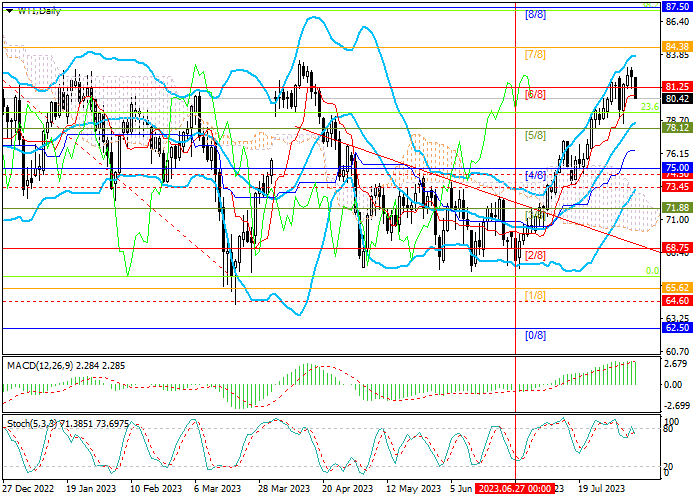
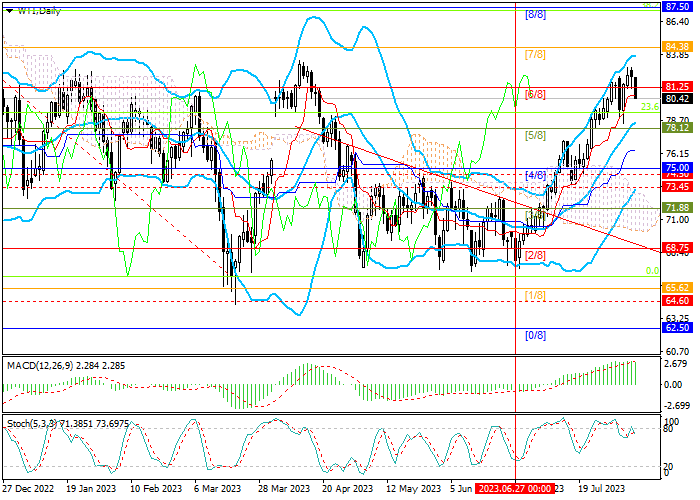
Technically, the price has dropped below 81.25 (Murray level [6/8]) and, while maintaining the current dynamics, it will be able to continue to decline to 78.12 (the middle line of the Bollinger Bands, Murray level [5/8]). With the reverse consolidation of quotes above 81.25, growth will be able to resume to the area of 84.38 (Murray level [7/8]) and 87.50 (Fibo retracement 38.2%, Murray level [8/8]).
Technical indicators do not give a single signal: the Bollinger Bands are directed upwards, the MACD histogram is stable in the positive zone, but the Stochastic reverses downwards near the overbought zone.
Resistance levels: 81.25, 84.38, 87.50.
Support levels: 78.12, 75.00.
Trading tips
Long positions can be opened from 81.80 or when the price reverses around 78.12 with targets at 84.38, 87.50 and stop-losses at 80.00 and 76.20, respectively. Implementation period: 5–7 days.
คำชี้แจง (Disclaimer) : เนื้อหาข้างต้นเป็นเพียงมุมมองของผู้เขียนแต่เพียงผู้เดียว และไม่ได้แสดงหรือสะท้อนถึงจุดยืนอย่างเป็นทางการของ Followme แต่อย่างใด Followme ไม่รับผิดชอบต่อความถูกต้อง ความครบถ้วน หรือความน่าเชื่อถือของข้อมูลที่ปรากฏ และจะไม่รับผิดชอบต่อการดำเนินการใด ๆ ที่เกิดขึ้นจากเนื้อหานั้น เว้นแต่จะมีการระบุไว้เป็นลายลักษณ์อักษรอย่างชัดเจน

