


| Scenario | |
|---|---|
| Timeframe | Intraday |
| Recommendation | SELL STOP |
| Entry Point | 0.6030 |
| Take Profit | 0.5941 |
| Stop Loss | 0.6090 |
| Key Levels | 0.5900, 0.5941, 0.6000, 0.6033, 0.6100, 0.6131, 0.6155, 0.6183 |
| Alternative scenario | |
|---|---|
| Recommendation | BUY STOP |
| Entry Point | 0.6100 |
| Take Profit | 0.6200 |
| Stop Loss | 0.6050 |
| Key Levels | 0.5900, 0.5941, 0.6000, 0.6033, 0.6100, 0.6131, 0.6155, 0.6183 |
Current trend
The New Zealand dollar is showing mixed trading dynamics, holding near 0.6055 and trying to correct after a two-day decline. Investors have taken a wait-and-see attitude and are in no hurry to open new positions ahead of the publication of key macroeconomic statistics from the US.
Today, the market will be looking at updated data on consumer inflation for July, suggesting that the annual value may accelerate from 3.0% to 3.3% after a fairly stable downward trend. However, experts doubt that such dynamics will significantly affect the rhetoric of the US Federal Reserve members, who are preparing to complete the current cycle of interest rate hikes. At the moment, they adhere to a scenario that does not involve adjusting the indicator until the end of this year.
In turn, pressure on the position of the instrument is still exerted by weak statistics from New Zealand and China. New Zealand data showed a notable decline in Electronic Card Retail Sales in July from 4.2% to 2.2% year-on-year, while analysts had expected a sharp rise to 9.8%. In China, the annual Consumer Price Index fell from 0.0% to -0.3% on an annualized basis, while the forecast was -0.4%, while the Producer Price Index corrected from -5.4% to -4.4%. Deflationary phenomena are observed in the country's economy, which indicate a slowdown in the pace of recovery, and in the future may lead to the introduction of additional stimulus measures by the government. In addition, consumer prices in China showed a decline for the first time in more than two years.
Support and resistance
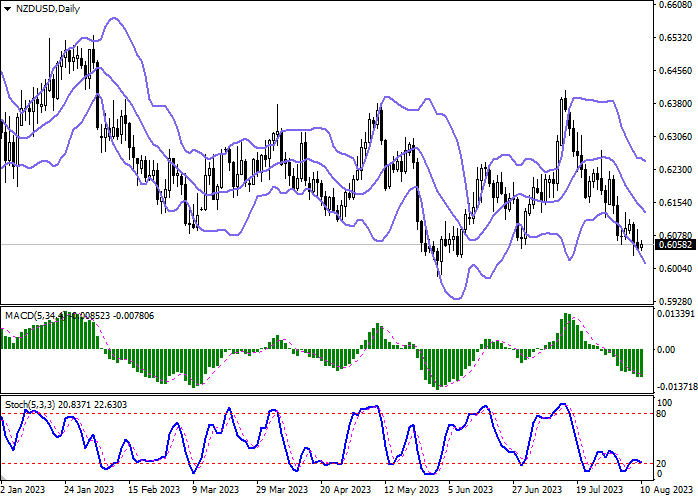
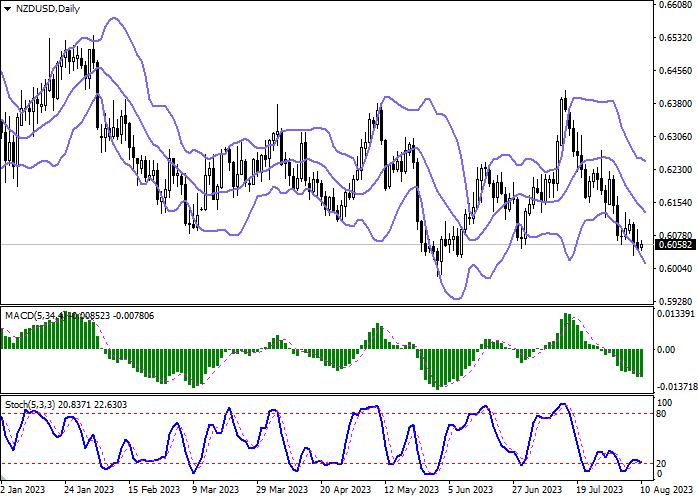
On the daily chart, Bollinger Bands are steadily declining. The price range expands from below, making way for new local lows for the "bears". MACD is trying to reverse upwards, but still maintains a relatively stable sell signal, being located below the signal line. Stochastic shows a horizontal direction, being close to the level of "20", emphasizing the risks of oversold New Zealand dollar in the ultra-short term.
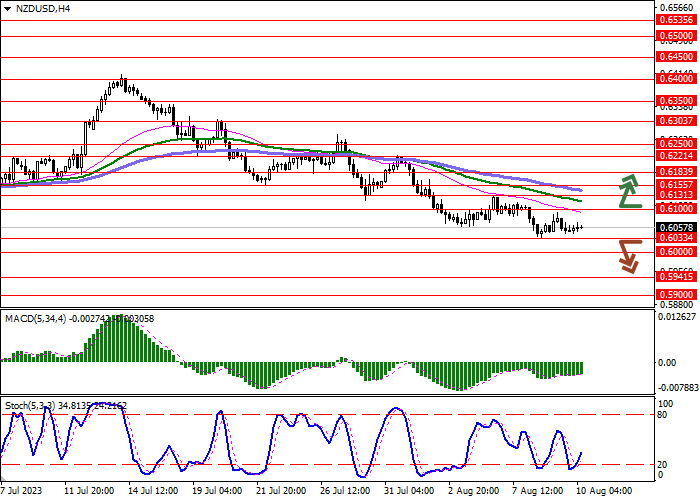
Resistance levels: 0.6100, 0.6131, 0.6155, 0.6183.
Support levels: 0.6033, 0.6000, 0.5941, 0.5900.
Trading tips
Short positions may be opened after a breakdown of 0.6033 with the target at 0.5941. Stop-loss — 0.6090. Implementation time: 2-3 days.
The return of the "bullish" trend with the breakout of 0.6100 may become a signal to open long positions with the target at 0.6200. Stop-loss — 0.6050.
คำชี้แจง (Disclaimer) : เนื้อหาข้างต้นเป็นเพียงมุมมองของผู้เขียนแต่เพียงผู้เดียว และไม่ได้แสดงหรือสะท้อนถึงจุดยืนอย่างเป็นทางการของ Followme แต่อย่างใด Followme ไม่รับผิดชอบต่อความถูกต้อง ความครบถ้วน หรือความน่าเชื่อถือของข้อมูลที่ปรากฏ และจะไม่รับผิดชอบต่อการดำเนินการใด ๆ ที่เกิดขึ้นจากเนื้อหานั้น เว้นแต่จะมีการระบุไว้เป็นลายลักษณ์อักษรอย่างชัดเจน

