


| Scenario | |
|---|---|
| Timeframe | Intraday |
| Recommendation | SELL STOP |
| Entry Point | 0.8700 |
| Take Profit | 0.8600 |
| Stop Loss | 0.8756 |
| Key Levels | 0.8600, 0.8650, 0.8700, 0.8756, 0.8800, 0.8850, 0.8875, 0.8918 |
| Alternative scenario | |
|---|---|
| Recommendation | BUY STOP |
| Entry Point | 0.8800 |
| Take Profit | 0.8875 |
| Stop Loss | 0.8756 |
| Key Levels | 0.8600, 0.8650, 0.8700, 0.8756, 0.8800, 0.8850, 0.8875, 0.8918 |
Current trend
The US dollar is trading mixed, holding near 0.8760, amid reduced market activity ahead of the publication of July statistics on US producer inflation, which will complement the macroeconomic report published the day before: adjusted annual CPI revised upward from 3.0% to 3.2%, which was worse than market expectations of 3.3%, while monthly rates remained unchanged at 0.2%, and Core CPI fell from 4.8% to 4.7%. Analysts believe that in July, the Producer Price Index will record an increase from 0.1% to 0.2% on a monthly basis and from 0.1% to 0.7% on an annualized basis, while the Core PPI will adjust from 0.1% to 0.2% and from 2.4% to 2.3%, respectively. Such results are unlikely to act as a catalyst for changing the rhetoric of the US Federal Reserve regarding the further increase in interest rates. Also the day before weekly data from the US labor market were presented, which turned out to be mixed: the number of Initial Jobless Claims amounted to 248.0 thousand, which is higher than the forecasts of 230.0 thousand, and the previous figure of 227.0 thousand, while the Continuing Jobless Claims decreased from 1.692 million to 1.684 million instead of the expected growth to 1.710 million.
With no macroeconomic data expected from Switzerland at the end of the week, market participants will focus on statistics from France, where annual inflation could reach 5.0%, and Spain, where the figure is likely to lock in at around 2.3%.
Support and resistance
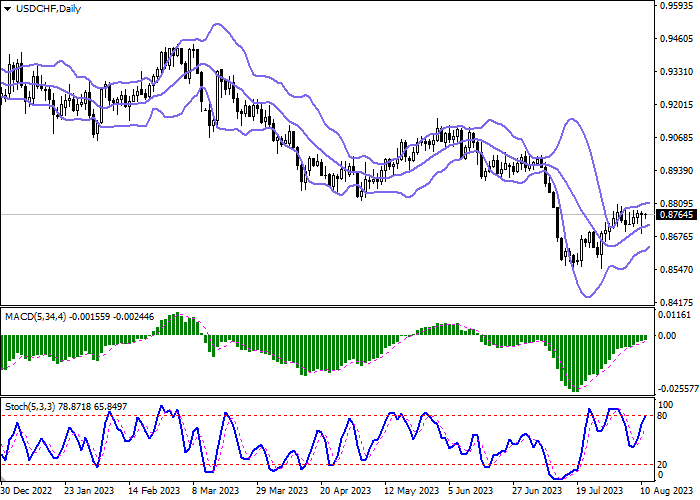
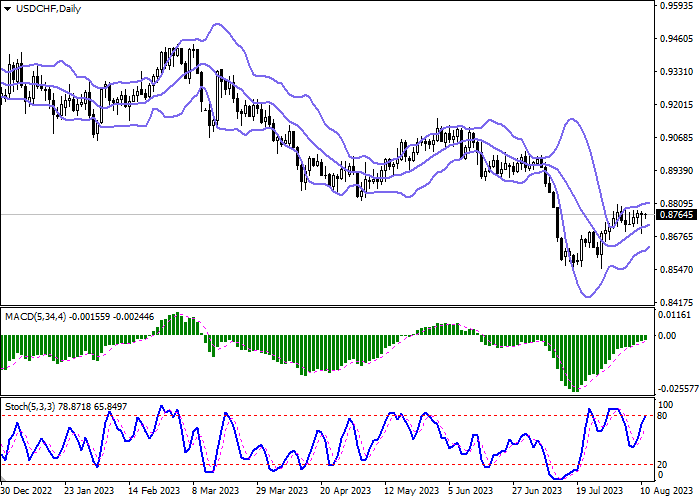
On the daily chart, Bollinger Bands show a moderate increase. The price range is narrowed from below, being spacious enough for the current activity level in the market. MACD is growing, maintaining a relatively strong buy signal, being located above the signal line. In addition, the indicator is approaching the zero level, the breakout of which can also be interpreted as a "bullish" signal. Stochastic remains in a confident upward direction, but is near the level of "80", indicating the risks of the US currency being overbought in the ultra-short term.
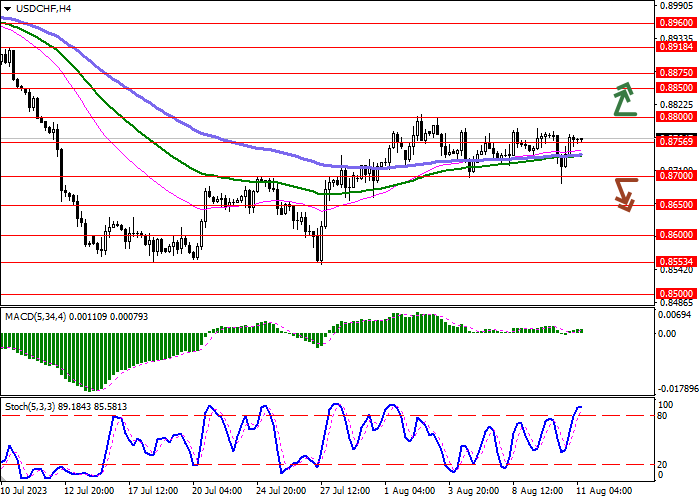
Resistance levels: 0.8800, 0.8850, 0.8875, 0.8918.
Support levels: 0.8756, 0.8700, 0.8650, 0.8600.
Trading tips
Short positions may be opened after a breakdown of 0.8700 with the target at 0.8600. Stop-loss — 0.8756. Implementation time: 2-3 days.
The return of the "bullish" trend with the breakout of 0.8800 may become a signal to open long positions with the target at 0.8875. Stop-loss — 0.8756.
คำชี้แจง (Disclaimer) : เนื้อหาข้างต้นเป็นเพียงมุมมองของผู้เขียนแต่เพียงผู้เดียว และไม่ได้แสดงหรือสะท้อนถึงจุดยืนอย่างเป็นทางการของ Followme แต่อย่างใด Followme ไม่รับผิดชอบต่อความถูกต้อง ความครบถ้วน หรือความน่าเชื่อถือของข้อมูลที่ปรากฏ และจะไม่รับผิดชอบต่อการดำเนินการใด ๆ ที่เกิดขึ้นจากเนื้อหานั้น เว้นแต่จะมีการระบุไว้เป็นลายลักษณ์อักษรอย่างชัดเจน

