


Scenario Timeframe Intraday Recommendation SELL STOP Entry Point 0.5940 Take Profit 0.5850 Stop Loss 0.6000 Key Levels 0.5800, .5850, 0.5900, 0.5941, 0.6000, 0.6033, 0.6100, 0.6131
Alternative scenario Recommendation BUY STOP Entry Point 0.6005 Take Profit 0.6100 Stop Loss 0.5941 Key Levels 0.5800, .5850, 0.5900, 0.5941, 0.6000, 0.6033, 0.6100, 0.6131
Current trend
During the Asian session on August 14, the New Zealand dollar is developing a downward trend , testing the level of 0.5960 for a breakdown under pressure from poor macroeconomic statistics from China and New Zealand.
Last week in China, for the first time in a long while, deflation was recorded: July consumer price index changed by –0.3% YoY after zero dynamics earlier, while adding 0.2% MoM after correction by a similar amount last month, supporting traders’ fears of a general slowdown in the performance of China, an important element in New Zealand’s export-led economy. In turn, the country is experiencing a drop in business activity: the service PMI changed from 47.4 points to 46.3 points, worse than the forecast of 49.4 points, and the Business NZ service PMI, published today, fell from 49.6 points to 47.8 points for the same period, which also was worse than the preliminary estimates of experts.
Tomorrow, traders will pay attention to the July data on industrial production and retail sales in China, which may grow from 4.4% to 4.5% YoY and from 3.1% to 4.8% MoM. On Tuesday, the US will release the price index for exports and imports: against retail sales, analysts expect an increase of 0.4% MoM after rising 0.2% earlier.
Support and resistance
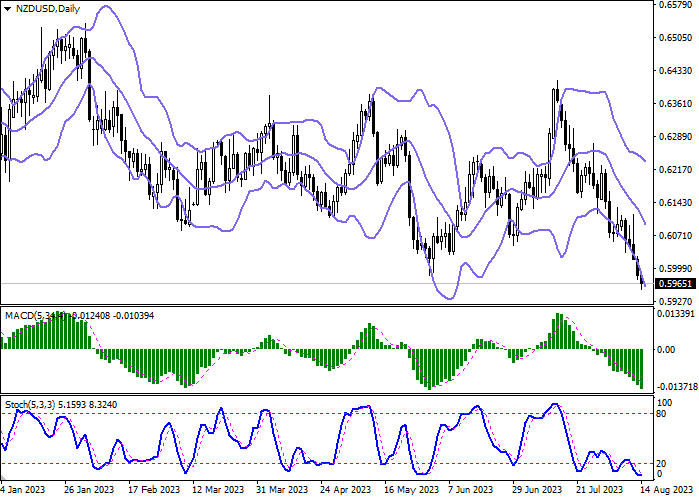
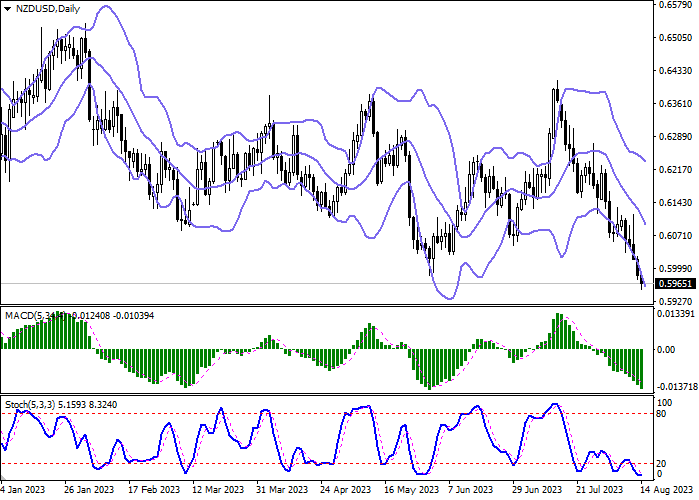
On the daily chart, Bollinger bands show a steady decline: the price range is expanding but not as fast as the “bearish” dynamics develop in the short term. MACD maintains a strong sell signal, being below the signal line. Stochastic, having reached its lows, reversed into a horizontal plane, indicating that the New Zealand dollar may become oversold soon.
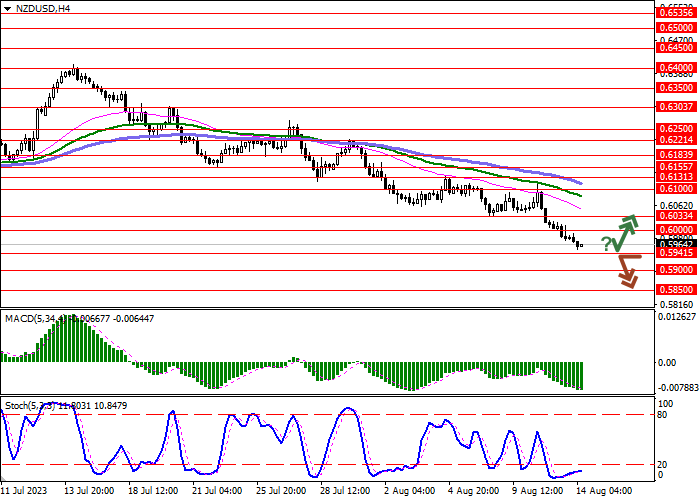
Resistance levels: 0.6000, 0.6033, 0.6100, 0.6131.
Support levels: 0.5941, 0.5900, 0.5850, 0.5800.
Trading tips
Short positions may be opened after a confident breakdown of 0.5941 with the target at 0.5850. Stop loss – 0.6000. Implementation period: 1–2 days.
Long positions may be opened after a rebound from 0.5941 and a breakout of 0.6000 with the target at 0.6100. Stop loss – 0.5941.
| Scenario | |
|---|---|
| Timeframe | Intraday |
| Recommendation | SELL STOP |
| Entry Point | 0.5940 |
| Take Profit | 0.5850 |
| Stop Loss | 0.6000 |
| Key Levels | 0.5800, .5850, 0.5900, 0.5941, 0.6000, 0.6033, 0.6100, 0.6131 |
| Alternative scenario | |
|---|---|
| Recommendation | BUY STOP |
| Entry Point | 0.6005 |
| Take Profit | 0.6100 |
| Stop Loss | 0.5941 |
| Key Levels | 0.5800, .5850, 0.5900, 0.5941, 0.6000, 0.6033, 0.6100, 0.6131 |
Current trend
During the Asian session on August 14, the New Zealand dollar is developing a downward trend , testing the level of 0.5960 for a breakdown under pressure from poor macroeconomic statistics from China and New Zealand.
Last week in China, for the first time in a long while, deflation was recorded: July consumer price index changed by –0.3% YoY after zero dynamics earlier, while adding 0.2% MoM after correction by a similar amount last month, supporting traders’ fears of a general slowdown in the performance of China, an important element in New Zealand’s export-led economy. In turn, the country is experiencing a drop in business activity: the service PMI changed from 47.4 points to 46.3 points, worse than the forecast of 49.4 points, and the Business NZ service PMI, published today, fell from 49.6 points to 47.8 points for the same period, which also was worse than the preliminary estimates of experts.
Tomorrow, traders will pay attention to the July data on industrial production and retail sales in China, which may grow from 4.4% to 4.5% YoY and from 3.1% to 4.8% MoM. On Tuesday, the US will release the price index for exports and imports: against retail sales, analysts expect an increase of 0.4% MoM after rising 0.2% earlier.
Support and resistance
On the daily chart, Bollinger bands show a steady decline: the price range is expanding but not as fast as the “bearish” dynamics develop in the short term. MACD maintains a strong sell signal, being below the signal line. Stochastic, having reached its lows, reversed into a horizontal plane, indicating that the New Zealand dollar may become oversold soon.
Resistance levels: 0.6000, 0.6033, 0.6100, 0.6131.
Support levels: 0.5941, 0.5900, 0.5850, 0.5800.
Trading tips
Short positions may be opened after a confident breakdown of 0.5941 with the target at 0.5850. Stop loss – 0.6000. Implementation period: 1–2 days.
Long positions may be opened after a rebound from 0.5941 and a breakout of 0.6000 with the target at 0.6100. Stop loss – 0.5941.
คำชี้แจง (Disclaimer) : เนื้อหาข้างต้นเป็นเพียงมุมมองของผู้เขียนแต่เพียงผู้เดียว และไม่ได้แสดงหรือสะท้อนถึงจุดยืนอย่างเป็นทางการของ Followme แต่อย่างใด Followme ไม่รับผิดชอบต่อความถูกต้อง ความครบถ้วน หรือความน่าเชื่อถือของข้อมูลที่ปรากฏ และจะไม่รับผิดชอบต่อการดำเนินการใด ๆ ที่เกิดขึ้นจากเนื้อหานั้น เว้นแต่จะมีการระบุไว้เป็นลายลักษณ์อักษรอย่างชัดเจน

