


| Scenario | |
|---|---|
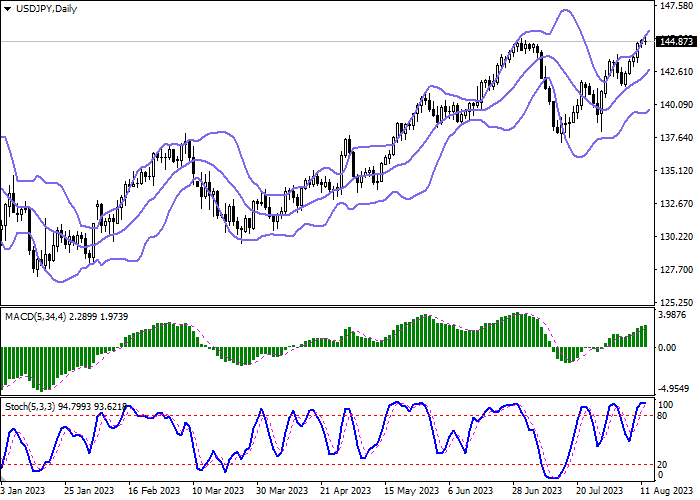
| Timeframe | Intraday |
| Recommendation | BUY STOP |
| Entry Point | 145.00 |
| Take Profit | 147.00 |
| Stop Loss | 144.00 |
| Key Levels | 142.00, 142.54, 143.48, 144.00, 145.00, 146.00, 147.00, 148.27 |
| Alternative scenario | |
|---|---|
| Recommendation | SELL STOP |
| Entry Point | 144.00 |
| Take Profit | 142.00 |
| Stop Loss | 145.00 |
| Key Levels | 142.00, 142.54, 143.48, 144.00, 145.00, 146.00, 147.00, 148.27 |
Current trend
The US dollar shows ambiguous trading dynamics in the USD/JPY pair: during the Asian session, the quotes stay near the record highs and the psychological mark of 145.00. Investors afraid that the breakout of this level will entail actions from the Bank of Japan. However, there is no tightening monetary policy expected but interventions, including verbal ones, are quite likely, as well as attempts to change the corridor of the yield curve of government bonds.
The Japanese regulator influenced the situation in September 2022, when the national currency also fell below 145.00, the Ministry of Finance announced purchases of the yen, which led to the growth of the instrument to the 140.00 area. Since then, the officials have taken a wait-and-see attitude, while inflation in the country has not shown the expected growth. The currency quotes are slightly supported by the neutral rhetoric of the US Federal Reserve, and therefore the difference in interest rates may no longer change.
On Tuesday, the focus of investors will be Japanese Q2 gross domestic product (GDP): the value may change from 2.7% to 3.1% YoY and from 0.7% to 0.8% QoQ. Implementation of these forecasts can significantly strengthen the yen against its main competitors. In the US, there will be data on retail sales for July: analysts’ forecasts are very optimistic and suggest an improvement in dynamics from 0.2% to 0.4% MoM.
Support and resistance
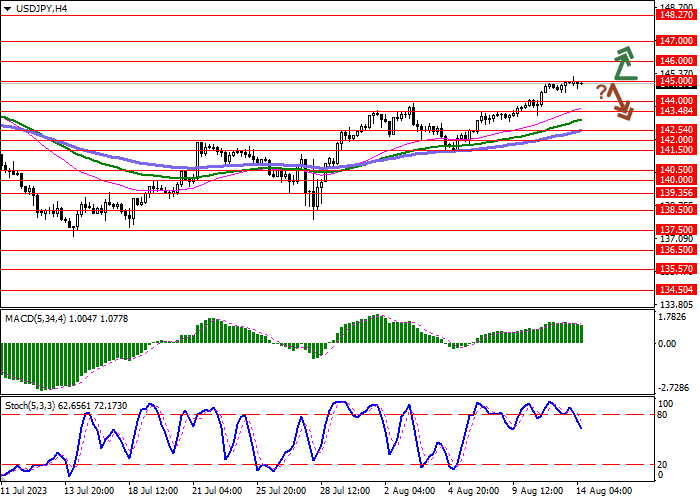
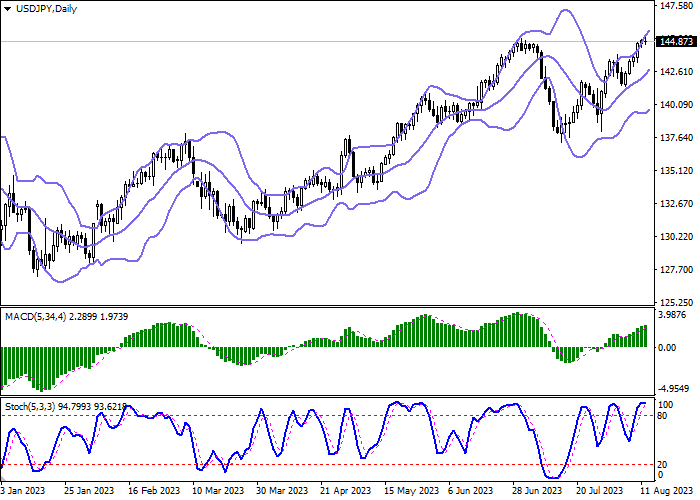
On the daily chart, Bollinger bands steadily grows: the price range narrows slightly from below but remains quite spacious for the current level of activity. MACD is growing, keeping a strong buy signal (the histogram is above the signal line). Stochastic reached its highs and reversed into a horizontal plane, indicating that the US dollar is overbought in the ultra-short term.
Resistance levels: 145.00, 146.00, 147.00, 148.27.
Support levels: 144.00, 143.48, 142.54, 142.00.
Trading tips
Long positions should be opened after a breakout of 145.00 with the target at 147.00. Stop loss – 144.00. Implementation period: 1–2 days.
Short positions may be opened after a rebound from 145.00 and a breakdown of 144.00 with the target at 142.00. Stop loss – 145.00.
คำชี้แจง (Disclaimer) : เนื้อหาข้างต้นเป็นเพียงมุมมองของผู้เขียนแต่เพียงผู้เดียว และไม่ได้แสดงหรือสะท้อนถึงจุดยืนอย่างเป็นทางการของ Followme แต่อย่างใด Followme ไม่รับผิดชอบต่อความถูกต้อง ความครบถ้วน หรือความน่าเชื่อถือของข้อมูลที่ปรากฏ และจะไม่รับผิดชอบต่อการดำเนินการใด ๆ ที่เกิดขึ้นจากเนื้อหานั้น เว้นแต่จะมีการระบุไว้เป็นลายลักษณ์อักษรอย่างชัดเจน

