


| Scenario | |
|---|---|
| Timeframe | Weekly |
| Recommendation | SELL STOP |
| Entry Point | 42.00 |
| Take Profit | 39.40 |
| Stop Loss | 43.00 |
| Key Levels | 39.00, 39.40, 43.00, 44.00, 44.80, 50.00 |
| Alternative scenario | |
|---|---|
| Recommendation | BUY STOP |
| Entry Point | 44.30 |
| Take Profit | 44.80 |
| Stop Loss | 43.00 |
| Key Levels | 39.00, 39.40, 43.00, 44.00, 44.80, 50.00 |
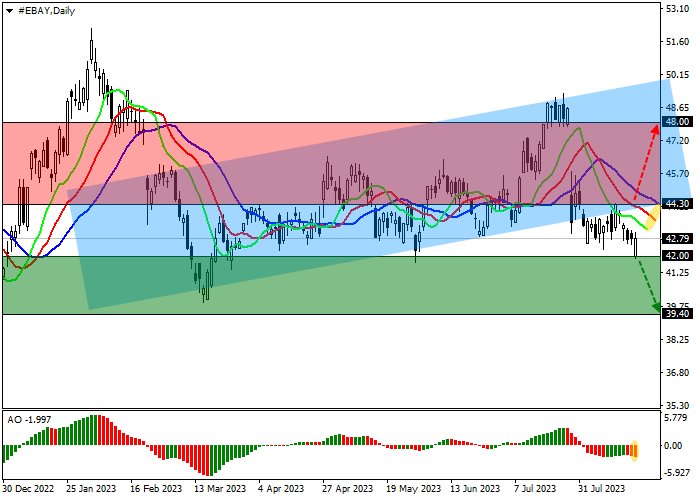
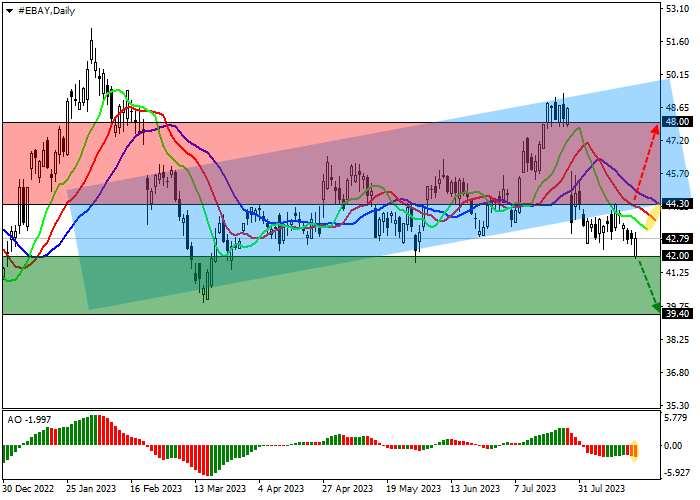
Shares of eBay Inc., an American online retailer, are trading at 43.00.
On the daily chart, the price is moving below the support line of the ascending corridor with dynamic boundaries at 44.00–50.00, preparing for a continuation of the decline.
On the four-hour chart, in case of development of negative dynamics, the key obstacle is the low of May 31 at 42.00, after consolidation below which, the quotes can reach the next support around 39.00. An upward scenario is possible if the instrument returns to the channel and consolidates above 44.00.
Technical indicators have reversed and are holding a sell signal: fast EMAs on the Alligator indicator are below the signal line, and the AO histogram is forming downward bars in the sell zone.
Trading tips
Short positions may be opened after the consolidation below 42.00 to reach 39.40. Stop loss — 43.00. Implementation period: 7 days or more.
Long positions may be opened after the price reverses, rises, and consolidates above 44.30 with the target at 48.00 and stop loss 43.00.
คำชี้แจง (Disclaimer) : เนื้อหาข้างต้นเป็นเพียงมุมมองของผู้เขียนแต่เพียงผู้เดียว และไม่ได้แสดงหรือสะท้อนถึงจุดยืนอย่างเป็นทางการของ Followme แต่อย่างใด Followme ไม่รับผิดชอบต่อความถูกต้อง ความครบถ้วน หรือความน่าเชื่อถือของข้อมูลที่ปรากฏ และจะไม่รับผิดชอบต่อการดำเนินการใด ๆ ที่เกิดขึ้นจากเนื้อหานั้น เว้นแต่จะมีการระบุไว้เป็นลายลักษณ์อักษรอย่างชัดเจน

