


| Scenario | |
|---|---|
| Timeframe | Intraday |
| Recommendation | SELL STOP |
| Entry Point | 1.2690 |
| Take Profit | 1.2600 |
| Stop Loss | 1.2740 |
| Key Levels | 1.2550, 1.2600, 1.2650, 1.2690, 1.2747, 1.2800, 1.2850, 1.2900 |
| Alternative scenario | |
|---|---|
| Recommendation | BUY STOP |
| Entry Point | 1.2750 |
| Take Profit | 1.2850 |
| Stop Loss | 1.2690 |
| Key Levels | 1.2550, 1.2600, 1.2650, 1.2690, 1.2747, 1.2800, 1.2850, 1.2900 |
Current trend
The GBP/USD pair is trading in a narrow price range, holding close to 1.2715. The day before, investors recorded a sharp surge in volatility associated with the publication of business activity indices for August in the UK and the US. British statistics turned out to be much worse than expected, but then the situation stabilized somewhat, and investors returned to the expectations of the annual Economic Policy Symposium in Jackson Hole, which will be addressed by US Federal Reserve Chairman Jerome Powell.
The British Manufacturing PMI from S&P Global in August fell from 45.3 points to 42.5 points, while the forecast for a decline to 45.0 points, and the Services PMI fell from 51.5 points to 48.7 points, while analysts expected a decline to 50.8 points. The Composite PMI corrected from 50.8 points to 48.3 points, while traders expected 50.5 points. The weakening of indicators in the manufacturing sector has continued since last August; however, the indicator for the services sector has so far supported the national economy, and its fall significantly disappointed investors. In addition, against the background of these statistics, Bank of England officials may pause the cycle of tightening monetary policy, although inflation in the country remains high.
In turn, US data indicated a decline in the Manufacturing PMI from 49.0 points to 47.0 points, and from 52.3 points to 51.0 points in the Services PMI, while analysts expected 49.3 points and 52.2 points respectively. Some support for the dollar was provided by the July statistics on the dynamics of New Home Sales in the US: the figure added 4.4% after falling by 2.8% in the previous month. In absolute terms, sales growth accelerated from 0.684 million to 0.714 million, while the forecast was 0.705 million.
Support and resistance
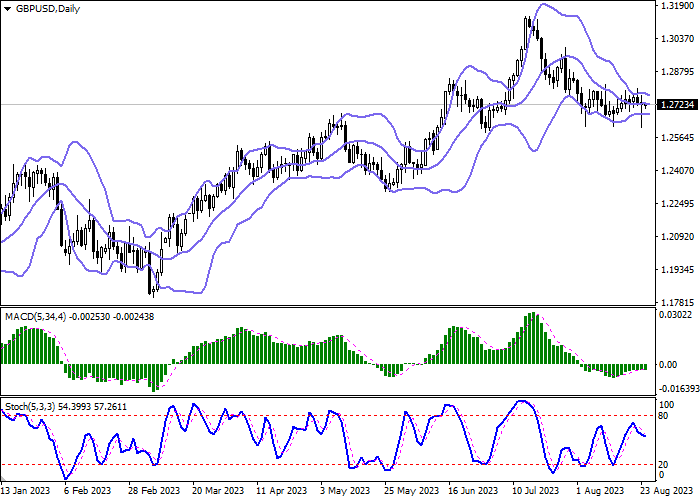
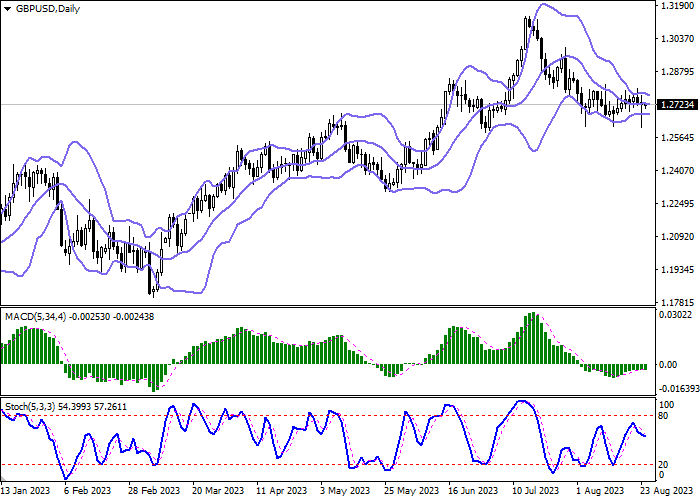
Bollinger Bands in D1 chart demonstrate flat dynamics. The price range narrows, remaining extremely narrow for the current level of activity in the market. MACD indicator tries to reverse downwards and to form a new sell signal (the histogram is about to consolidate below the signal line). Stochastic is showing similar dynamics having reversed downwards in the center of its area.
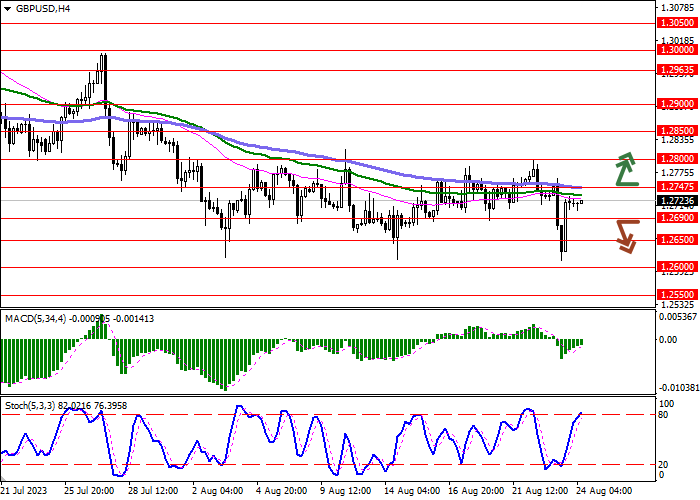
Resistance levels: 1.2747, 1.2800, 1.2850, 1.2900.
Support levels: 1.2690, 1.2650, 1.2600, 1.2550.
Trading tips
Short positions may be opened after a breakdown of 1.2690 with the target at 1.2600. Stop-loss — 1.2740. Implementation time: 2-3 days.
The development of the "bullish" trend with the breakout of 1.2747 may become a signal for opening long positions with the target of 1.2850. Stop-loss — 1.2690.
คำชี้แจง (Disclaimer) : เนื้อหาข้างต้นเป็นเพียงมุมมองของผู้เขียนแต่เพียงผู้เดียว และไม่ได้แสดงหรือสะท้อนถึงจุดยืนอย่างเป็นทางการของ Followme แต่อย่างใด Followme ไม่รับผิดชอบต่อความถูกต้อง ความครบถ้วน หรือความน่าเชื่อถือของข้อมูลที่ปรากฏ และจะไม่รับผิดชอบต่อการดำเนินการใด ๆ ที่เกิดขึ้นจากเนื้อหานั้น เว้นแต่จะมีการระบุไว้เป็นลายลักษณ์อักษรอย่างชัดเจน

