


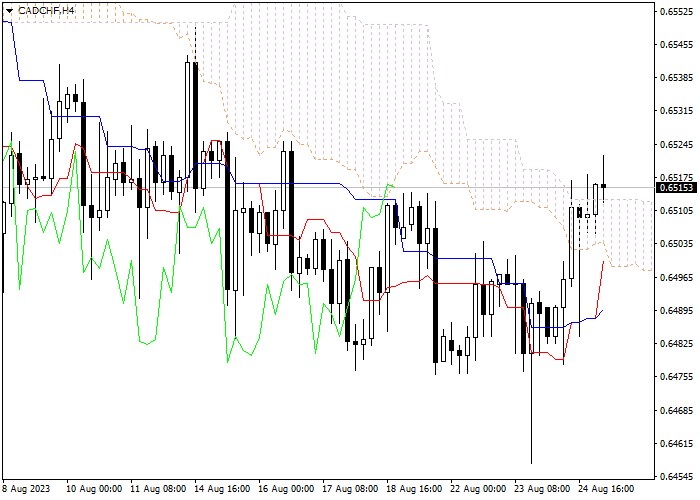
Let's look at the four-hour chart. Tenkan-sen line is above Kijun-sen, both lines are directed upwards. Confirmative line Chikou Span is below the price chart, current cloud is descending. The instrument is trading above Tenkan-sen and Kijun-sen lines; the Bullish trend is still strong. The closest support level is Kijun-sen line (0.6489). One of the previous maximums of Chikou Span line is expected to be a resistance level (0.6541).
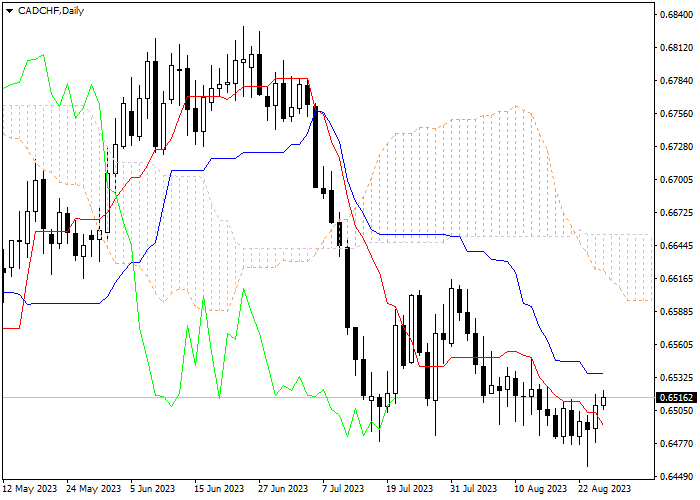
On the daily chart Tenkan-sen line is below Kijun-sen, the red line is directed downwards, while the blue one remains horizontal. Confirmative line Chikou Span is below the price chart, current cloud is descending. The instrument is trading between Tenkan-sen and Kijun-sen lines. One of the previous minimums of Chikou Span line is expected to be a support level (0.6457). One of the previous maximums of Chikou Span line is expected to be a resistance level (0.6575).
On the four-hour chart the instrument is still rising. On the daily chart we can see a correction of the downward movement. It is recommended to open long positions at current price with Take Profit at the level of previous maximum of Chikou Span (0.6572) line and Stop Loss at the level of Kijun-sen line (0.6489).
คำชี้แจง (Disclaimer) : เนื้อหาข้างต้นเป็นเพียงมุมมองของผู้เขียนแต่เพียงผู้เดียว และไม่ได้แสดงหรือสะท้อนถึงจุดยืนอย่างเป็นทางการของ Followme แต่อย่างใด Followme ไม่รับผิดชอบต่อความถูกต้อง ความครบถ้วน หรือความน่าเชื่อถือของข้อมูลที่ปรากฏ และจะไม่รับผิดชอบต่อการดำเนินการใด ๆ ที่เกิดขึ้นจากเนื้อหานั้น เว้นแต่จะมีการระบุไว้เป็นลายลักษณ์อักษรอย่างชัดเจน

