We present a medium-term investment overview of the leading index of the London Stock Exchange FTSE 100.
Since mid-September, the indicator has been under pressure, retreating slightly from its highs against monetary stabilization measures: it was unable to overcome the annual record around 7700.0 and has been developing a “bearish” trend for the third week in a row. The key factor behind the negative dynamics is the situation in the British economy: although, according to the results of the revised data for the second quarter, gross domestic product (GDP) increased by 0.6% YoY, the increase was only 0.2% QoQ, close to the edge of recession. There was a reversal in the country’s monetary policy at the end of last month: the Bank of England kept the interest rate unchanged at 5.25% for the first time since December, noting that the economy should recover from the long-term “hawkish” course. Back in the summer, experts expected the figure to reach 6.50%, and now analysts predict that at the meeting on November 2, the regulator will keep the pause in tightening.
Thus, there are now two global pressure factors for the stock index: the first and main one is the emergence of the “dovish” rhetoric of the Bank of England. The regulator intends to return inflation to the target range of around 2.0%, and a positive trend is already developing: the consumer price index decreased from 6.8% to 6.7%. The second reason for the negative dynamics is the proximity of a recession in the economy. Despite the slight economic growth, GDP is still far from even the stability zone, and the possibility of a decline remains.
The nation’s businesses are under pressure from high credit pressures and rising logistics costs, while demand for UK shares is under pressure amid record bond yields: the 10-year bond yield stood at 4.629% yesterday, the year’s high of 13 August, and in a longer period – of the beginning of October 2008, and with such values, strengthening the positions of stock indicators is impossible.
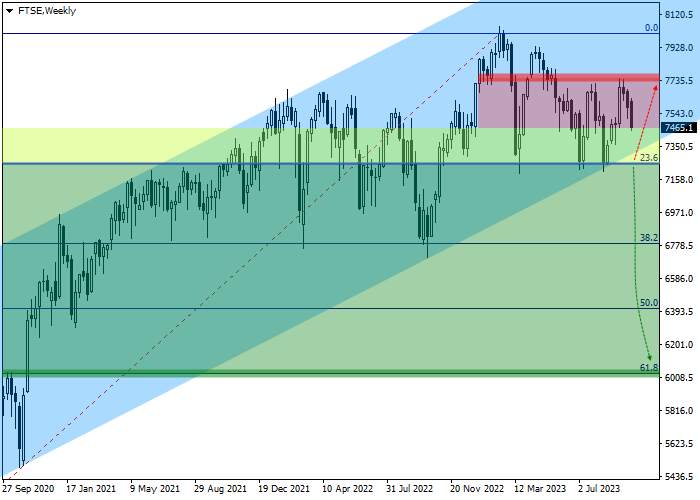
In addition to the underlying fundamental factors, a possible decline is confirmed by the readings of technical indicators: on the weekly chart, the price is moving within the global ascending channel with dynamic boundaries of 7300.0–8950.0, falling to the support line.

In addition to the proximity of the support line of the global ascending channel, the quotes are approaching the initial correction level of 23.6% Fibonacci 7250.0, which is a key marker for continued decline. The main factors indicate a high probability of negative dynamics developing towards the full correction level of 61.8% Fibonacci. Let’s consider the key levels on the daily chart.
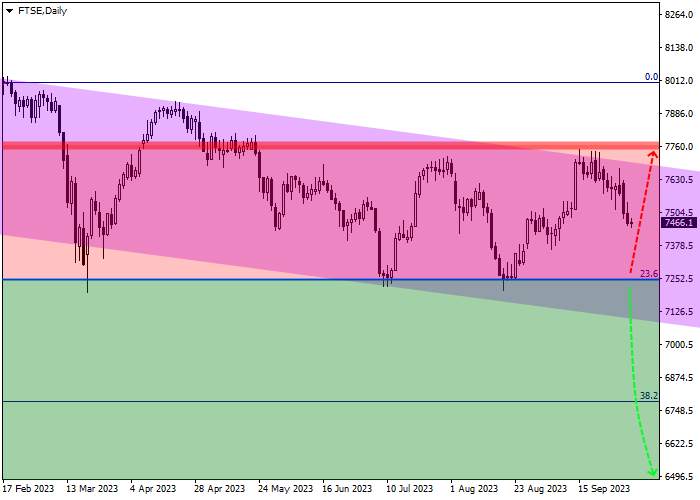
As can be seen on the chart, the price has already formed the necessary reversal formation, the point of implementation of which coincides with the initial correction of 23.6% Fibonacci at 7250.0, tested three times this year. After a breakout of the local high of September 15 around 7750.0 and subsequent growth, the downward scenario will either be canceled or noticeably delayed, it is better to liquidate open sell positions. Around 6000.0, which coincides with the 61.8% Fibonacci full correction level, there is the target zone, after reaching which it is worth taking profits on open sell positions.
Let’s assess the trade entry levels in more detail on the four-hour chart.
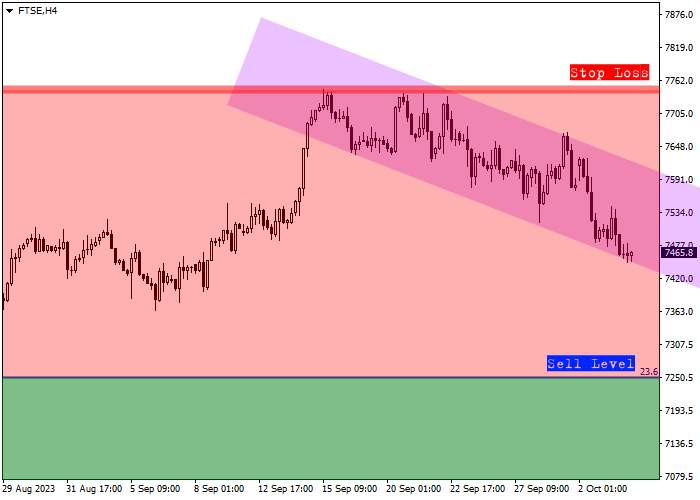
The entry level for sell transactions is at 7250.0, which coincides with the initial correction level of 23.6% Fibonacci, and a local signal can be received in the coming days after its breakdown. After this, on the price’s path to the target level of 6000.0, there will be two more significant supports: the basic correction level of 38.2% (6780.0) and the intermediate correction level of 50.0% (6400.0), where periods of consolidation are possible.
Considering the average daily volatility of a trading instrument over the past month, which is 420.0 points, the price movement to the target zone of 6000.0 may take approximately 63 trading sessions, and if volatility increases, this time may reduce to 55 trading days.
คำชี้แจง (Disclaimer) : เนื้อหาข้างต้นเป็นเพียงมุมมองของผู้เขียนแต่เพียงผู้เดียว และไม่ได้แสดงหรือสะท้อนถึงจุดยืนอย่างเป็นทางการของ Followme แต่อย่างใด Followme ไม่รับผิดชอบต่อความถูกต้อง ความครบถ้วน หรือความน่าเชื่อถือของข้อมูลที่ปรากฏ และจะไม่รับผิดชอบต่อการดำเนินการใด ๆ ที่เกิดขึ้นจากเนื้อหานั้น เว้นแต่จะมีการระบุไว้เป็นลายลักษณ์อักษรอย่างชัดเจน

เขียนข้อความของคุณตอนนี้