


![USD/CAD: THE PAIR IS PREPARING TO END THE WEEK WITH INSIGNIFICANT GROWTH]()
Scenario Timeframe Intraday Recommendation BUY STOP Entry Point 1.3705 Take Profit 1.3800 Stop Loss 1.3650 Key Levels 1.3500, 1.3550, 1.3600, 1.3650, 1.3700, 1.3750, 1.3800, 1.3853
Alternative scenario Recommendation SELL STOP Entry Point 1.3645 Take Profit 1.3550 Stop Loss 1.3700 Key Levels 1.3500, 1.3550, 1.3600, 1.3650, 1.3700, 1.3750, 1.3800, 1.3853
Current trend
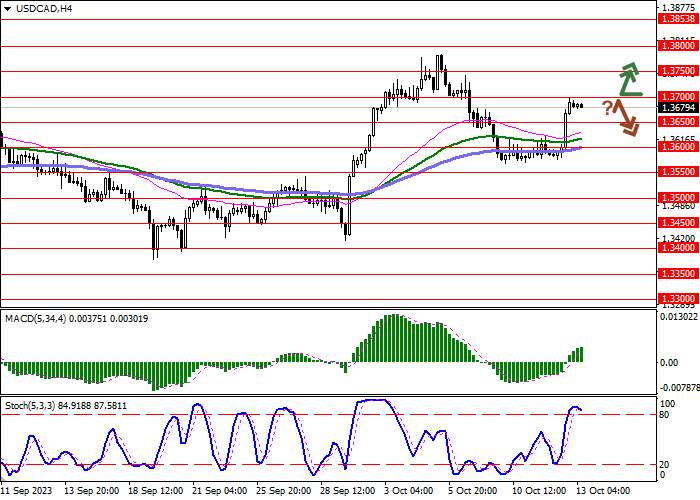
The USD/CAD pair shows multidirectional dynamics, consolidating near 1.3680 and local highs from October 6. The instrument is preparing to end the next week with weak growth, which became possible thanks to the active strengthening of the position of the American currency against the backdrop of the publication of inflation statistics in the United States.
The Consumer Price Index in September remained at the same level of 3.7% in annual terms, while analysts expected 3.6%, and in monthly terms the indicator slowed down from 0.6% to 0.4%, which also turned out to be slightly higher than expectations at 0.3%. Core CPI, as expected, fell from 4.3% to 4.1% in annual terms and remained unchanged at 0.3% in monthly terms. Higher rates of price growth increase the risk of a possible interest rate adjustment by the US Federal Reserve by 25 basis points before the end of this year.
On Wednesday, Canada published data on the dynamics of Building Permits: in August the figure increased by 3.4% after -3.8% in the previous month, exceeding forecasts at 0.5%.
Support and resistance
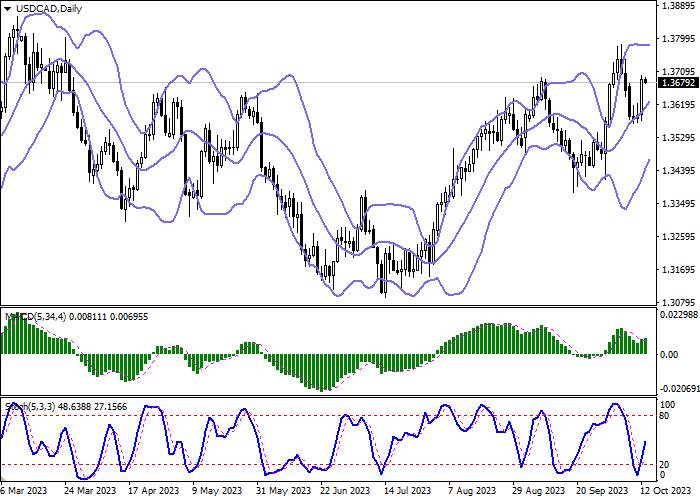
Bollinger Bands on the daily chart show a steady increase. The price range is narrowing, reflecting ambiguous dynamics of trading in the short term. MACD is reversing upwards and forming a new buy signal (located above the signal line). Stochastic is showing a more active growth and is located in the middle of its area.
Resistance levels: 1.3700, 1.3750, 1.3800, 1.3853.
Support levels: 1.3650, 1.3600, 1.3550, 1.3500.
Trading tips
Long positions may be opened after a breakout of 1.3700 with the target at 1.3800. Stop-loss — 1.3650. Implementation time: 2-3 days.
A rebound from 1.3700 as from resistance, followed by a breakdown of 1.3650 may become a signal for opening of new short positions with the target at 1.3550. Stop-loss — 1.3700.
| Scenario | |
|---|---|
| Timeframe | Intraday |
| Recommendation | BUY STOP |
| Entry Point | 1.3705 |
| Take Profit | 1.3800 |
| Stop Loss | 1.3650 |
| Key Levels | 1.3500, 1.3550, 1.3600, 1.3650, 1.3700, 1.3750, 1.3800, 1.3853 |
| Alternative scenario | |
|---|---|
| Recommendation | SELL STOP |
| Entry Point | 1.3645 |
| Take Profit | 1.3550 |
| Stop Loss | 1.3700 |
| Key Levels | 1.3500, 1.3550, 1.3600, 1.3650, 1.3700, 1.3750, 1.3800, 1.3853 |
Current trend
The USD/CAD pair shows multidirectional dynamics, consolidating near 1.3680 and local highs from October 6. The instrument is preparing to end the next week with weak growth, which became possible thanks to the active strengthening of the position of the American currency against the backdrop of the publication of inflation statistics in the United States.
The Consumer Price Index in September remained at the same level of 3.7% in annual terms, while analysts expected 3.6%, and in monthly terms the indicator slowed down from 0.6% to 0.4%, which also turned out to be slightly higher than expectations at 0.3%. Core CPI, as expected, fell from 4.3% to 4.1% in annual terms and remained unchanged at 0.3% in monthly terms. Higher rates of price growth increase the risk of a possible interest rate adjustment by the US Federal Reserve by 25 basis points before the end of this year.
On Wednesday, Canada published data on the dynamics of Building Permits: in August the figure increased by 3.4% after -3.8% in the previous month, exceeding forecasts at 0.5%.
Support and resistance
Bollinger Bands on the daily chart show a steady increase. The price range is narrowing, reflecting ambiguous dynamics of trading in the short term. MACD is reversing upwards and forming a new buy signal (located above the signal line). Stochastic is showing a more active growth and is located in the middle of its area.
Resistance levels: 1.3700, 1.3750, 1.3800, 1.3853.
Support levels: 1.3650, 1.3600, 1.3550, 1.3500.
Trading tips
Long positions may be opened after a breakout of 1.3700 with the target at 1.3800. Stop-loss — 1.3650. Implementation time: 2-3 days.
A rebound from 1.3700 as from resistance, followed by a breakdown of 1.3650 may become a signal for opening of new short positions with the target at 1.3550. Stop-loss — 1.3700.
คำชี้แจง (Disclaimer) : เนื้อหาข้างต้นเป็นเพียงมุมมองของผู้เขียนแต่เพียงผู้เดียว และไม่ได้แสดงหรือสะท้อนถึงจุดยืนอย่างเป็นทางการของ Followme แต่อย่างใด Followme ไม่รับผิดชอบต่อความถูกต้อง ความครบถ้วน หรือความน่าเชื่อถือของข้อมูลที่ปรากฏ และจะไม่รับผิดชอบต่อการดำเนินการใด ๆ ที่เกิดขึ้นจากเนื้อหานั้น เว้นแต่จะมีการระบุไว้เป็นลายลักษณ์อักษรอย่างชัดเจน

เขียนข้อความของคุณตอนนี้