Shares of 3M Co., an American diversified innovation and manufacturing company, are trading at 103.00.
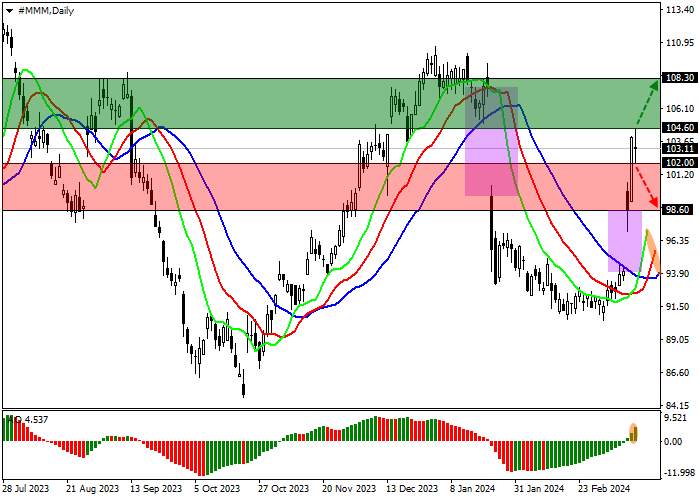
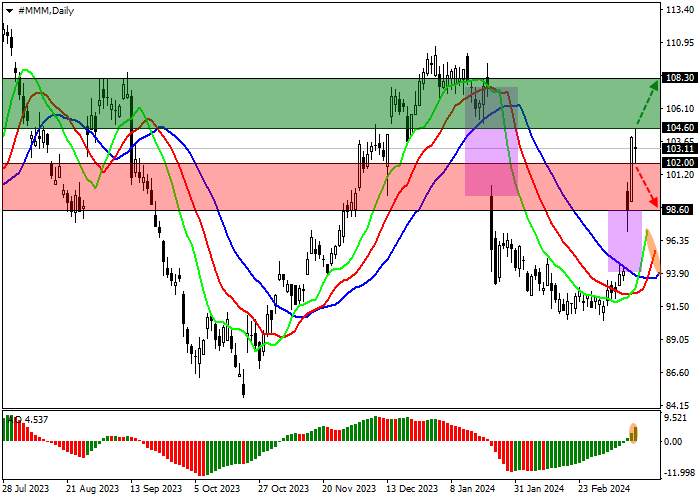
On the daily chart, the price is correcting within the global sideways channel 108.00–86.00.
On the four-hour chart, growth may continue, and the key resistance level is yesterday’s high of 104.60, after consolidating above which the quotes may reach the early January extreme of 108.70. Otherwise, a return to completion of the local price gap of 98.60–94.00 is expected.
Technical indicators are holding a buy signal: fast EMA on the Alligator indicator are significantly above the signal line, and the AO histogram is forming corrective bars in the buy zone.
Trading tips
Long positions may be opened after the price rises and consolidates above 104.60, with the target at 108.30. Stop loss – 103.00. Implementation period: 7 days or more.
Short positions may be opened after the price declines and consolidates below 102.00, with the target at 98.60. Stop loss – 103.00.




เขียนข้อความของคุณตอนนี้