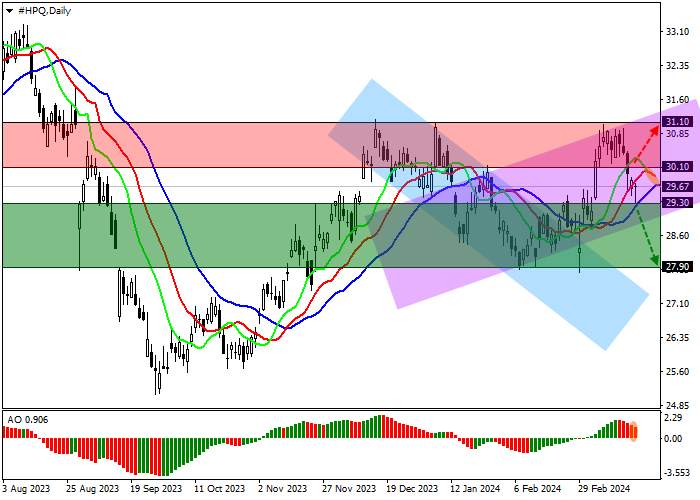
Shares of Hewlett-Packard Co., the American information technology giant, are trading at 29.67.
On the daily chart, the price is correcting within a local ascending corridor with dynamic boundaries of 31.00–29.00.
On the four-hour chart, the current trend is downward, and the quotes are moving towards the support line of 29.00. After consolidating below, a further decline to the early February low of 27.80 is possible. In case of an upward reversal, the price may reach the year’s high of 31.00.
Technical indicators are weakening the buy signal: fast EMAs on the Alligator indicator are approaching the signal line, and the AO histogram is forming corrective bars, approaching the transition level.
Trading tips
Short positions may be opened after the price declines and consolidates below 29.30, with the target at 27.90. Stop loss – 30.00. Implementation period: 7 days or more.
Long positions may be opened after the price rises and consolidates above 30.10, with the target at 31.10. Stop loss – 29.50.



เขียนข้อความของคุณตอนนี้