Shares of Apple Inc., a giant in the development and sale of personal and tablet computers, are moving in a corrective trend at 172.00.
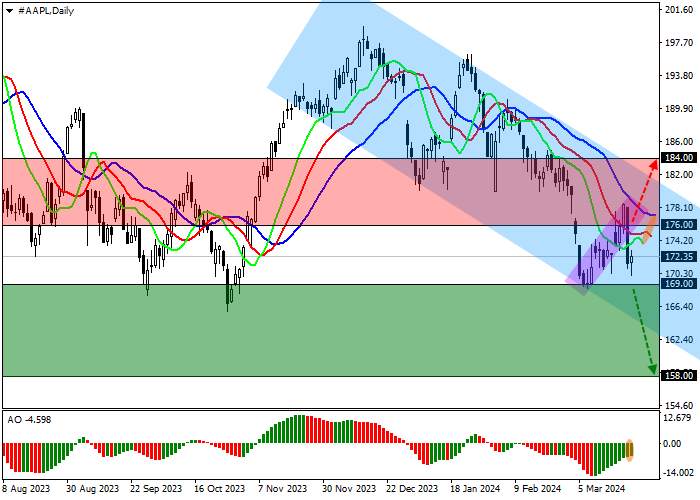
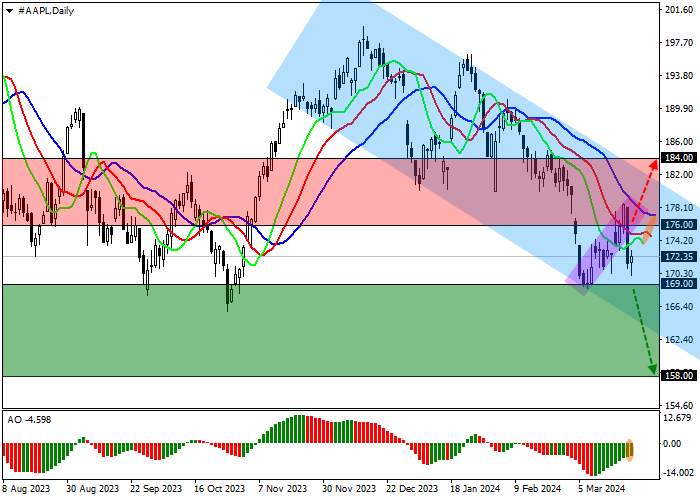
On the daily chart, the price is declining within the downward corridor of 182.00–166.00 toward the support line.
On the four-hour chart, the current trend is confirmed by the beginning of the implementation of a local Flag pattern of trend continuation with the implementation level at 173.00, as well as the quotes are near the year’s low of 169.00, which they can overcome this week.
Technical indicators reflect the weakening of the trading instrument: fast EMAs on the Alligator indicator maintain a stable sell signal, and the AO histogram forms corrective bars below the transition level.
Trading tips
Short positions may be opened after the price declines and consolidates below 169.00, with the target at 158.00. Stop loss is above 175.00. Implementation period: 7 days or more.
Long positions may be opened after the price rises and consolidates above 176.00, with the target at 184.00 and stop loss 172.00.




เขียนข้อความของคุณตอนนี้