


| Scenario | |
|---|---|
| Timeframe | Weekly |
| Recommendation | BUY STOP |
| Entry Point | 151.60 |
| Take Profit | 153.12, 156.25 |
| Stop Loss | 150.60 |
| Key Levels | 146.87, 149.50, 151.56, 153.12, 156.25 |
| Alternative scenario | |
|---|---|
| Recommendation | SELL STOP |
| Entry Point | 149.50 |
| Take Profit | 146.87 |
| Stop Loss | 150.90 |
| Key Levels | 146.87, 149.50, 151.56, 153.12, 156.25 |
Current trend
Despite the tightening of monetary policy by the Bank of Japan, the USD/JPY pair has been steadily growing for the third week in a row, trading at 151.80.
Japanese government officials believe that the negative performance of the yen is associated solely with speculative activity, while most experts note that the regulator’s interest rate, even after increasing to 0.10%, remains significantly lower than that of the world’s leading central banks, ensuring continued pressure on the national currency. Recent economic data and comments from politicians confirm the uncertainty of further monetary policy, which also does not support the yen. Thus, February weighted average consumer price index adjusted from 1.9% to 1.4%, which contradicts officials’ statements about a stable movement of inflation towards the target level of 2.0%. Representatives of the Bank of Japan are giving conflicting signals to the market: today, board member of the regulator Naoki Tamura said that it was necessary to continue the slow and steady tightening of monetary policy, and the head of the department, Kazuo Ueda, said that it was important to support the national economy being on the verge of recession, which can be interpreted as a warning about a possible postponement of further increases in borrowing costs.
Most likely, the uncertainty of further actions by the financial authorities will continue to put pressure on the yen in the medium term if the government does not undertake currency interventions, which it has been warning about for months.
Support and resistance
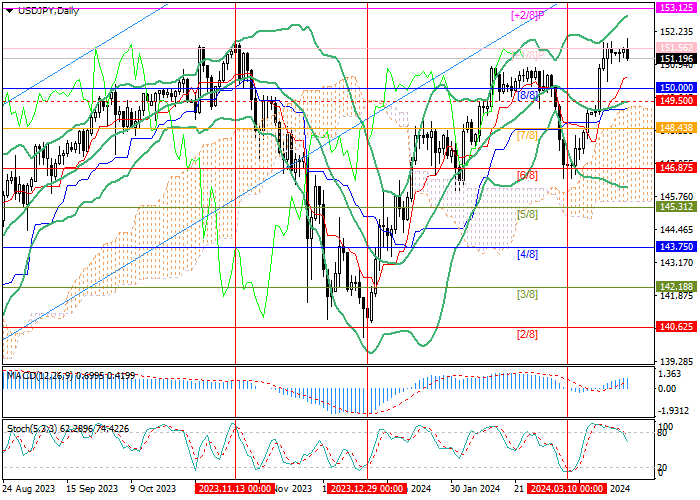
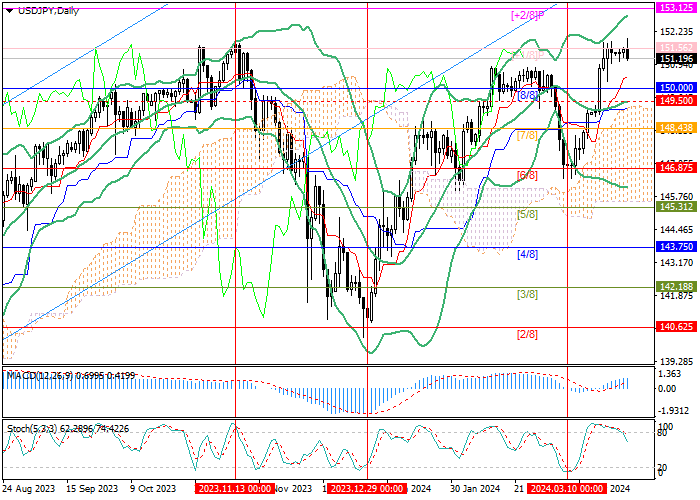
The trading instrument is testing 151.56 (Murrey level [ 1/8]), consolidation above which will allow it to reach the area of 153.12 (Murrey level [ 2/8]) and 156.25 (Murrey level [ 2/8], W1). If the key “bearish” support zone 150.00–149.50 (Murrey level [8/8], middle line of Bollinger bands) is broken down, a decline is expected to 146.87 (Murrey level [6/8]).
Technical indicators maintain a buy signal: Bollinger bands reverse upwards, and the MACD histogram grows in the positive zone. Stochastic has left the overbought zone, which does not exclude a correction, which is unlikely to lead to a change in trend.
Resistance levels: 151.56, 153.12, 156.25.
Support levels: 149.50, 146.87.
Trading tips
Long positions may be opened above 151.56 with the targets at 153.12, 156.25 and stop loss around 150.60. Implementation time: 5–7 days.
Short positions may be opened below 149.50 with the target at 146.87 and stop loss around 150.90.
คำชี้แจง (Disclaimer) : เนื้อหาข้างต้นเป็นเพียงมุมมองของผู้เขียนแต่เพียงผู้เดียว และไม่ได้แสดงหรือสะท้อนถึงจุดยืนอย่างเป็นทางการของ Followme แต่อย่างใด Followme ไม่รับผิดชอบต่อความถูกต้อง ความครบถ้วน หรือความน่าเชื่อถือของข้อมูลที่ปรากฏ และจะไม่รับผิดชอบต่อการดำเนินการใด ๆ ที่เกิดขึ้นจากเนื้อหานั้น เว้นแต่จะมีการระบุไว้เป็นลายลักษณ์อักษรอย่างชัดเจน

