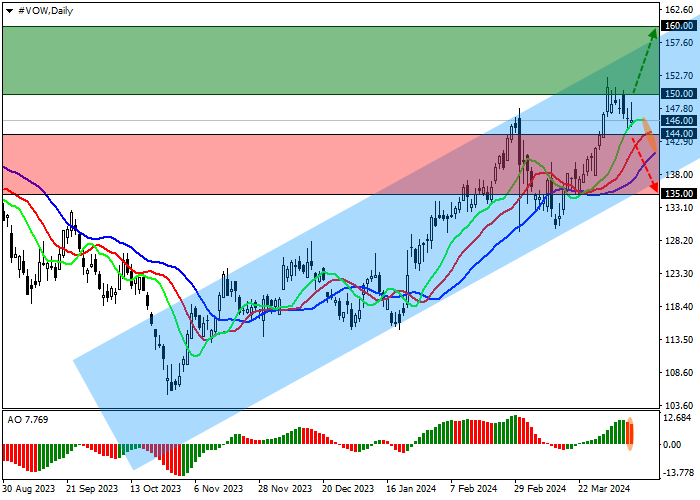
Shares of Volkswagen AG, a German automobile corporation, are moving within an intensifying correction, trading just below the 146.00 level.
On the daily chart, the asset is approaching the resistance line of the ascending channel with dynamic boundaries of 158.00–135.00.
On the four-hour chart, the quotes have overcome the year’s high of 148.00 and are completing its reverse testing, after which growth to the channel resistance line of 160.00 is expected.
Technical indicators maintain a buy signal: fast EMA of the Alligator indicator are above the signal line, maintaining a wide fluctuation range, and the AO histogram forms corrective bars above the transition level.
Trading tips
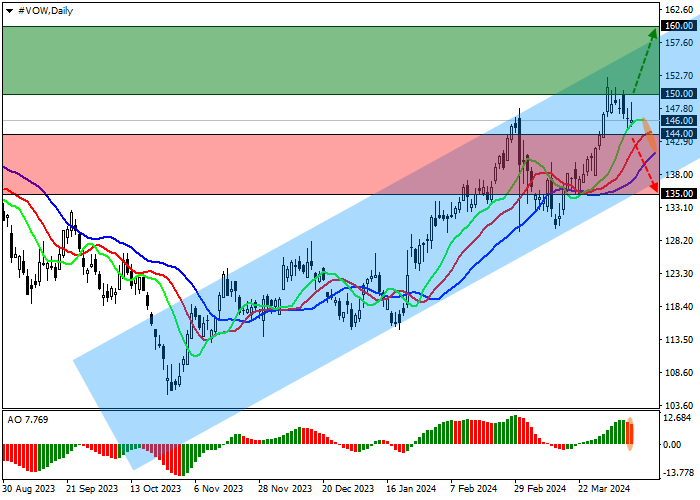
Long positions may be opened after the price rises and consolidates above 150.00, with the target at 160.00 and stop loss 146.00. Implementation period: 7 days or more.
Short positions may be opened after the price declines and consolidates below 144.00, with the target at 135.00. Stop loss – 148.00.