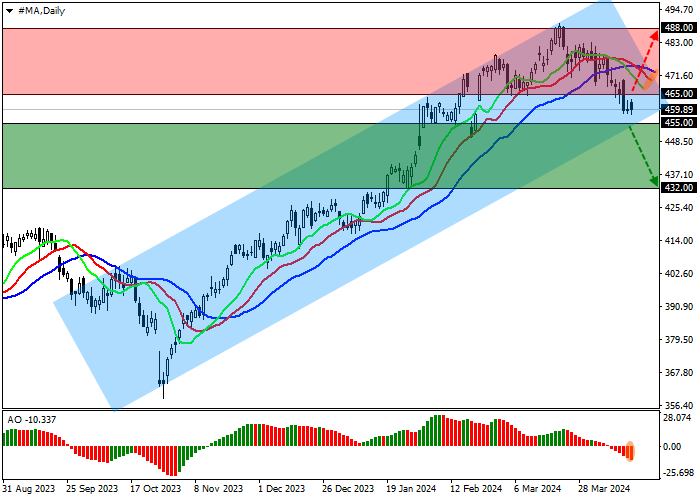
Shares of MasterCard Inc., one of the largest American multinational companies providing payment transaction services, are trading at 459.00.
On the daily chart, the price is approaching the support line of a long-term ascending corridor with dynamic boundaries of 490.00–450.00.
On the four-hour chart, the likelihood of strengthening downward dynamics has increased significantly after consolidating below the local low of 465.00. If it remains below it, the quotes may reach the channel support level of 430.00.
Technical indicators strengthen the sell signal: fast EMA on the Alligator indicator are below the signal line, expanding the range of fluctuations, and the AO histogram forms correctional bars below the transition level.
Trading tips
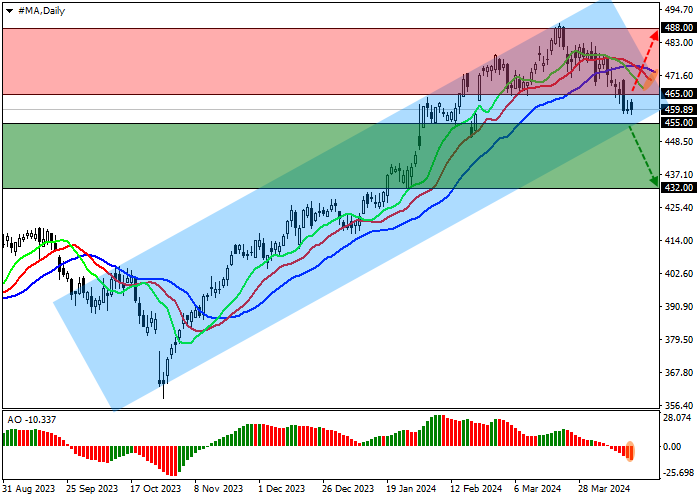
Short positions may be opened after the price declines and consolidates below 455.00, with the target at 432.00. Stop loss – 462.00. Implementation period: 7 days or more.
Long positions may be opened after the price rises and consolidates above 465.00, with the target at 488.00. Stop loss – 455.00.