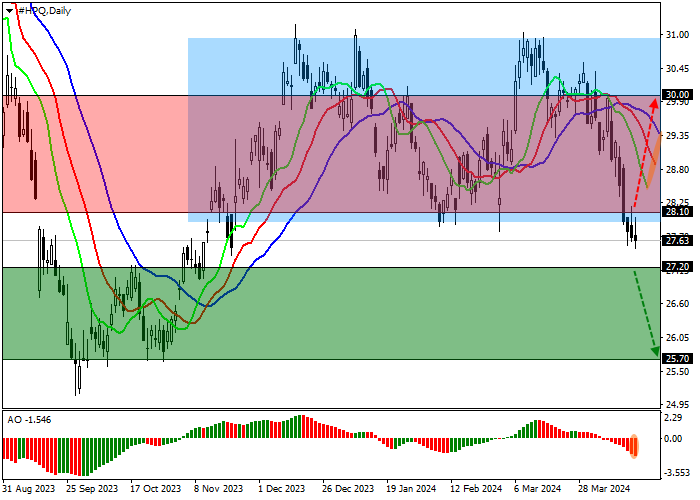
Shares of Hewlett-Packard Co., an American information technology giant, are trading within a correctional trend at 27.63.
On the daily chart, the price is trying to consolidate below the support line of the sideways corridor 28.00–31.00.
On the four-hour chart, negative dynamics received significant support after overcoming the level of 28.00, which allowed the quotes to reach the early year’s low of 25.00. However, after a return to the sideways range and a breakdown of the support line of 28.10, an increase to the channel resistance line of 31.00 is expected.
Technical indicators are strengthening the sell signal: fast EMA on the Alligator indicator are moving away from the signal line, and the AO histogram is forming corrective bars in the negative zone.
Trading tips
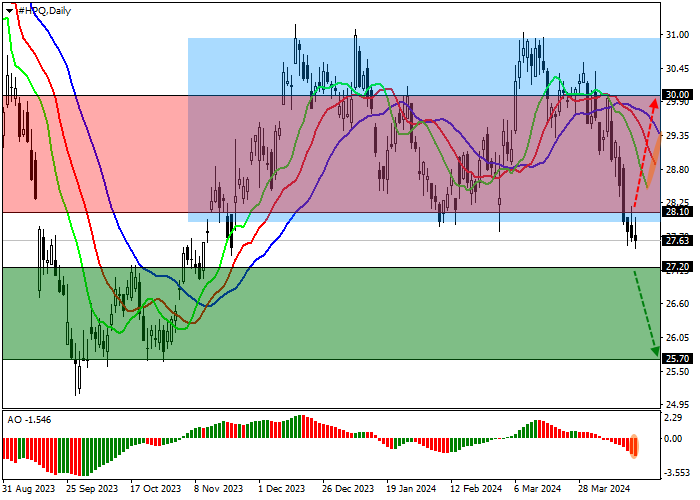
Short positions may be opened after the price declines and consolidates below 27.20, with the target at 25.70. Stop loss – 28.20. Implementation period: 7 days or more.
Long positions may be opened after the price rises and consolidates above 28.10, with the target at 30.00. Stop loss – 27.40.