
EUR/CAD: ICHIMOKU INDICATORS ANALYSIS

avatar
· Views 135


EUR/CAD: ICHIMOKU INDICATORS ANALYSIS
Scenario
TimeframeIntraday
RecommendationSELL
Entry Point1.46360
Take Profit1.46200
Stop Loss1.46565
Key Levels1.45810, 1.46200, 1.46565, 1.46750
EUR/CAD: ICHIMOKU INDICATORS ANALYSIS

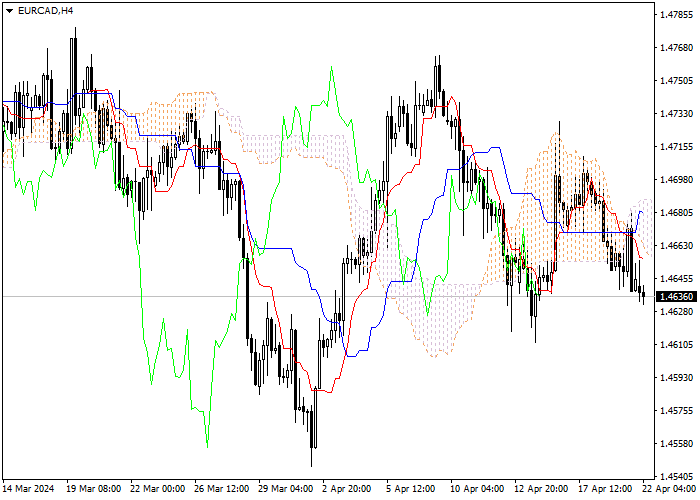
Let's look at the four-hour chart. Tenkan-sen line is below Kijun-sen, the red line is directed downwards, while the blue one remains horizontal. Confirmative line Chikou Span is crossing the price chart from above, current cloud is descending. The instrument is trading below Tenkan-sen and Kijun-sen lines; the Bearish trend is still strong. The closest support level is Tenkan-sen line (1.46565). One of the previous maximums of Chikou Span line is expected to be a resistance level (1.46200).


EUR/CAD: ICHIMOKU INDICATORS ANALYSIS

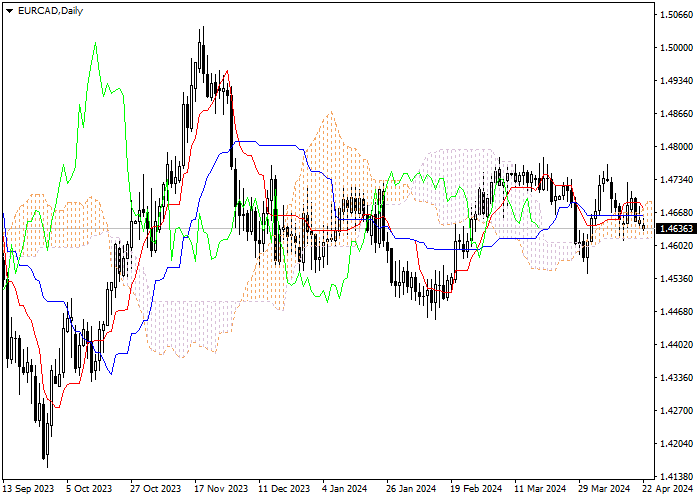
On the daily chart Tenkan-sen line is above Kijun-sen, the lines are horizontal . Confirmative line Chikou Span is below the price chart, current cloud is ascending. The instrument is trading around lower border of the cloud. The closest support level is Tenkan-sen line (1.46750). One of the previous maximums of Chikou Span line is expected to be a resistance level (1.45810).


On the four-hour chart we've got a signal of trend reversal from ascending to descending. On the daily chart the instrument is trading within the cloud. It is recommended to open short positions at current price with Take Profit at the level of previous minimum of Chikou Span line (1.46200) and Stop Loss at the level of Kijun-sen line (1.46565).


คำชี้แจง (Disclaimer) : เนื้อหาข้างต้นเป็นเพียงมุมมองของผู้เขียนแต่เพียงผู้เดียว และไม่ได้แสดงหรือสะท้อนถึงจุดยืนอย่างเป็นทางการของ Followme แต่อย่างใด Followme ไม่รับผิดชอบต่อความถูกต้อง ความครบถ้วน หรือความน่าเชื่อถือของข้อมูลที่ปรากฏ และจะไม่รับผิดชอบต่อการดำเนินการใด ๆ ที่เกิดขึ้นจากเนื้อหานั้น เว้นแต่จะมีการระบุไว้เป็นลายลักษณ์อักษรอย่างชัดเจน

ชอบบทความนี้ไหม? แสดงความขอบคุณโดยการส่งทิปให้ผู้เขียน
ตอบกลับ 0

  • tradingContest
