


| Scenario | |
|---|---|
| Timeframe | Intraday |
| Recommendation | BUY STOP |
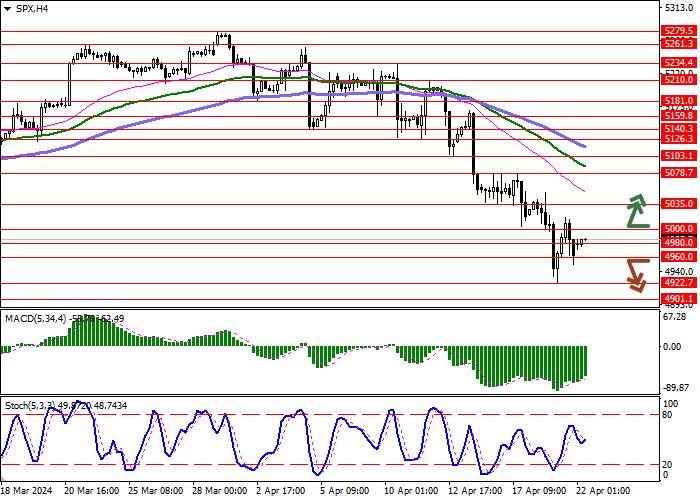
| Entry Point | 5000.0 |
| Take Profit | 5078.7 |
| Stop Loss | 4960.0 |
| Key Levels | 4901.1, 4922.7, 4960.0, 4980.0, 5000.0, 5035.0, 5078.7, 5103.1 |
| Alternative scenario | |
|---|---|
| Recommendation | SELL STOP |
| Entry Point | 4960.0 |
| Take Profit | 4901.1 |
| Stop Loss | 4990.0 |
| Key Levels | 4901.1, 4922.7, 4960.0, 4980.0, 5000.0, 5035.0, 5078.7, 5103.1 |
Current trend
The S&P 500 index shows mixed dynamics, remaining close to 4985.0. The asset is prone to a slight upward correction, having ended last week with a confident decline and updating the local lows of February 13. Analysts are somewhat concerned about the pace of decline in American stock markets, but there are no signs yet that scenarios of a fall of 30.0-50.0% by the end of the year could be realized.
However, monetary policy in the country remains unchanged, as the Consumer Price Index still exceeds the US Federal Reserve's targets. Last week, the Chair of the regulator, Jerome Powell, once again said that the path of inflation to 2.0% may take a little longer than initially estimated. Against this background, investors once again doubted the likelihood of an interest rate cut in June. Now the most plausible scenario remains an adjustment in the rate in September, while some analysts predict a change in monetary policy only at the end of this year. At the same time, economic activity in the United States remains quite strong: the Beige Book report presented last week reflected weak growth in ten of the twelve counties.
The index is also under pressure from the start of the season for publishing financial results of its component companies. In particular, the capitalization of the insurance company The Travelers Companies Inc. decreased by 7.4%. A weak report from ASML Holding NV, which produces equipment for producing chips, led to a decline in shares of integrated electronics manufacturer Advanced Micro Devices Inc. by 5.8%, shares of graphics processor company Nvidia Corp. lost 3.9%, and shares of information technology company Super Micro Computer Inc. fell by 1.7%.
The focus of investors today will be the March statistics on the Chicago Fed National Activity Index, and tomorrow the April data on business activity will be published: forecasts suggest that the Services PMI will remain around the previous value at 51.7 points. and the manufacturing PMI at 51.9 points. On Thursday, quarterly statistics on Gross Domestic Product (GDP) will hit the market: in the first quarter, the national economy is expected to slow down from 3.4% to 2.5%.
Support and resistance
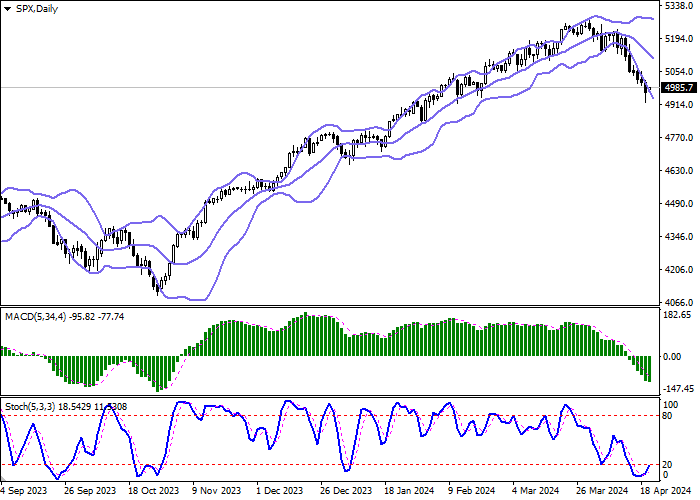
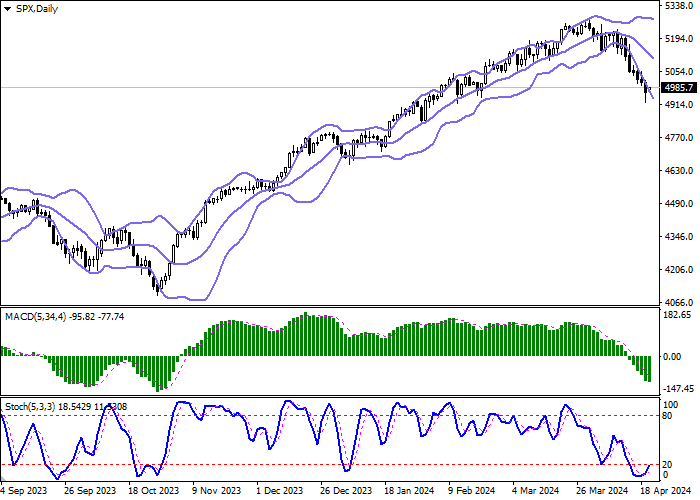
Bollinger Bands on the daily chart show a steady decline. The price range is expanding from below; however, it fails to catch the surge of the "bearish" sentiment at the moment. MACD is going down preserving a stable sell signal (located below the signal line). Stochastic is trying to retreat from its lows, reversed into an ascending plane, signaling in favor of the development of corrective growth of the instrument in the near future.
Resistance levels: 5000.0, 5035.0, 5078.7, 5103.1.
Support levels: 4980.0, 4960.0, 4922.7, 4901.1.
Trading tips
Long positions can be opened after a breakout of 5000.0 with the target of 5078.7. Stop-loss — 4960.0. Implementation time: 2-3 days.
The return of a "bearish" trend with the breakdown of 4960.0 may become a signal for new short positions with the target at 4901.1. Stop-loss — 4990.0.
คำชี้แจง (Disclaimer) : เนื้อหาข้างต้นเป็นเพียงมุมมองของผู้เขียนแต่เพียงผู้เดียว และไม่ได้แสดงหรือสะท้อนถึงจุดยืนอย่างเป็นทางการของ Followme แต่อย่างใด Followme ไม่รับผิดชอบต่อความถูกต้อง ความครบถ้วน หรือความน่าเชื่อถือของข้อมูลที่ปรากฏ และจะไม่รับผิดชอบต่อการดำเนินการใด ๆ ที่เกิดขึ้นจากเนื้อหานั้น เว้นแต่จะมีการระบุไว้เป็นลายลักษณ์อักษรอย่างชัดเจน

