


Hello everyone. In today’s article, we will look at the past performance of the 1H Hour Elliott Wave chart of SPDR Metals & Mining ETF ($XME). The rally from 3.14.2024 low at $55.37 unfolded as 5 waves impulse. So, we expected the pullback to unfold in 3 swings and find buyers again. We will explain the structure & forecast below:
5 Wave Impulse Structure + ABC correction
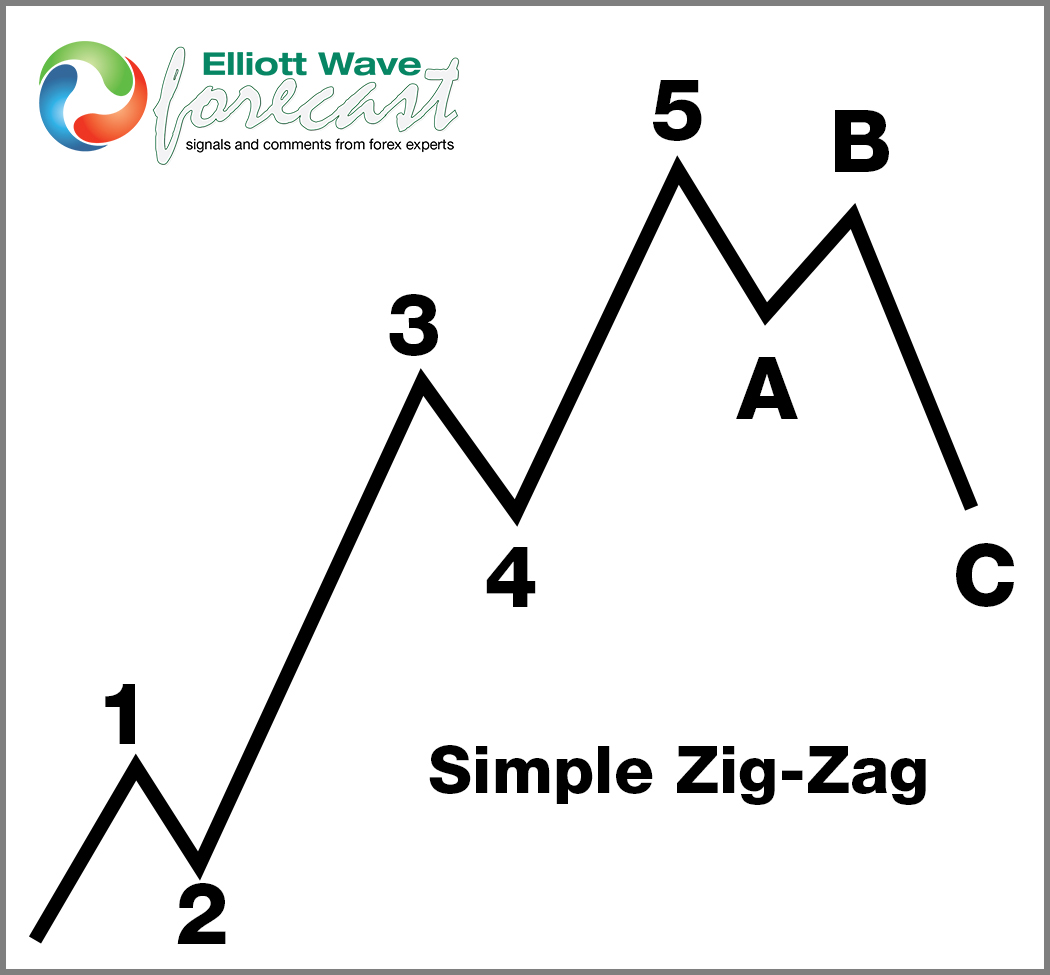
$XME 1H Elliott Wave Chart 4.15.2024:
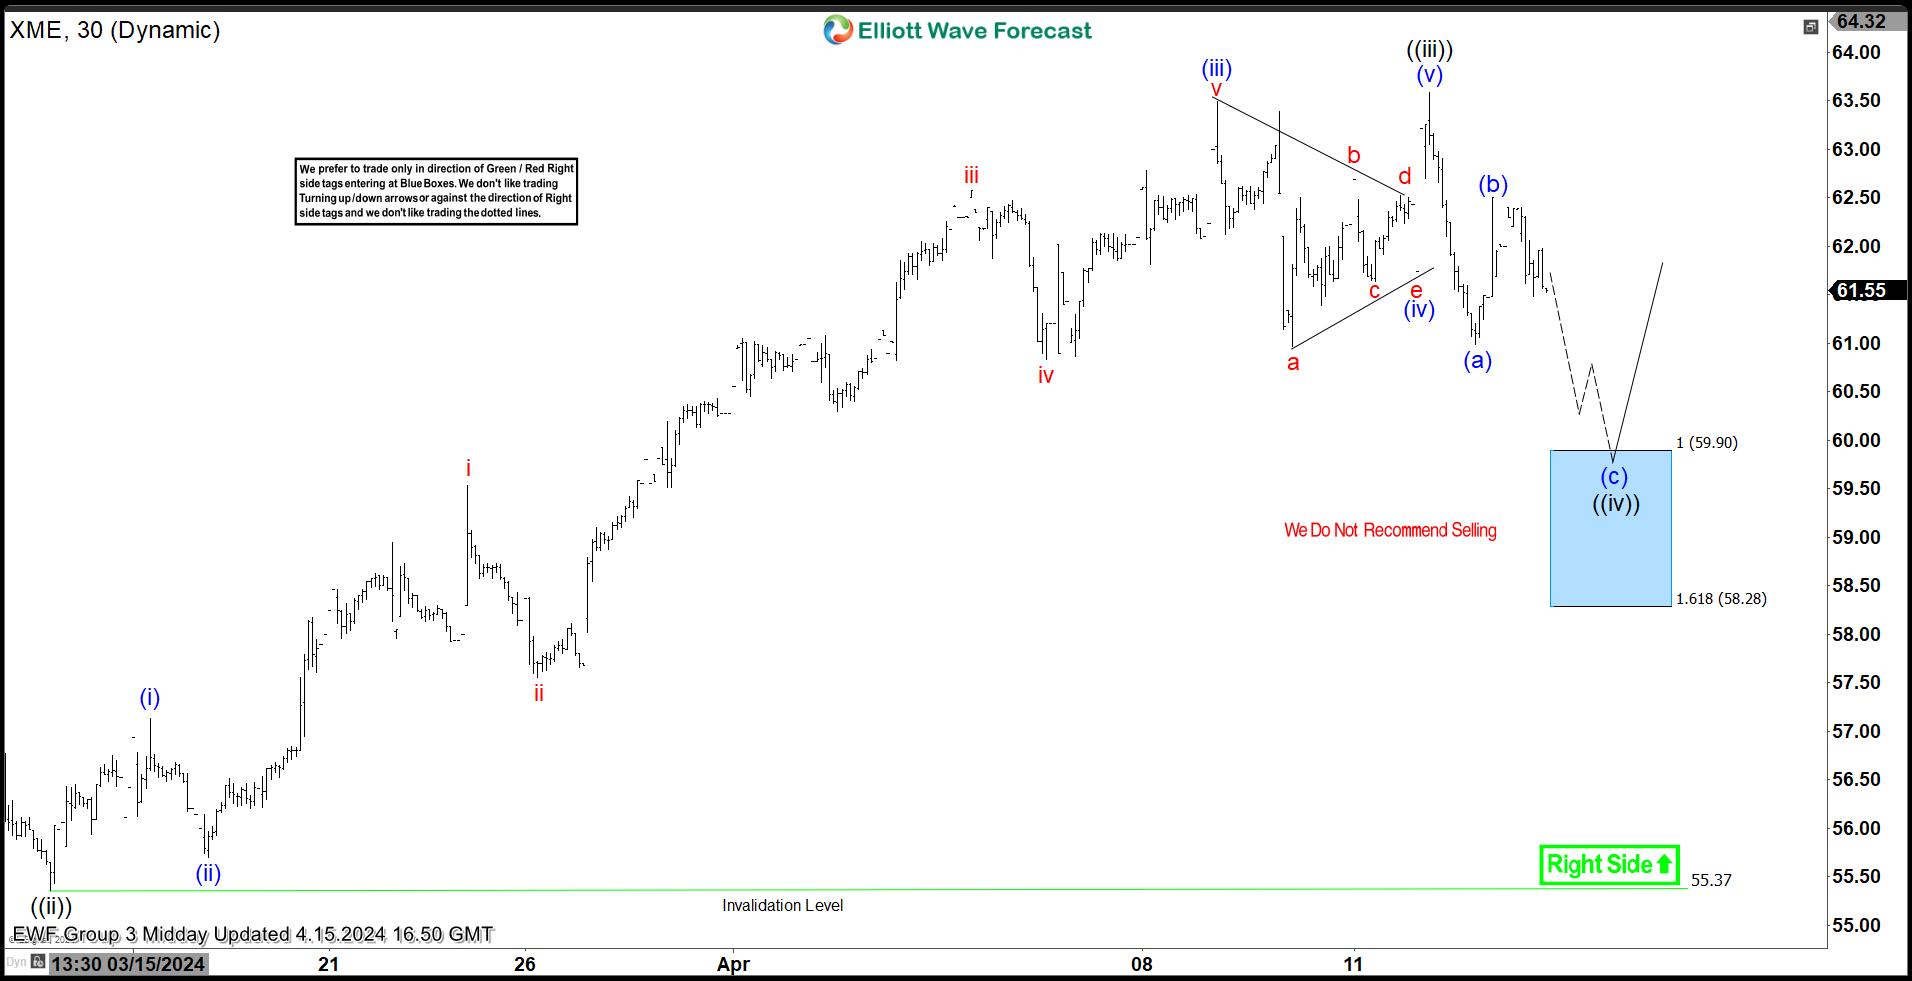 Here is the 1H Elliott Wave count from 4.15.2024. We expected the pullback to find buyers at the blue box area at 59.90 – 58.28 in 3 swings.
$XME 1H Elliott Wave Chart 4.17.2024:
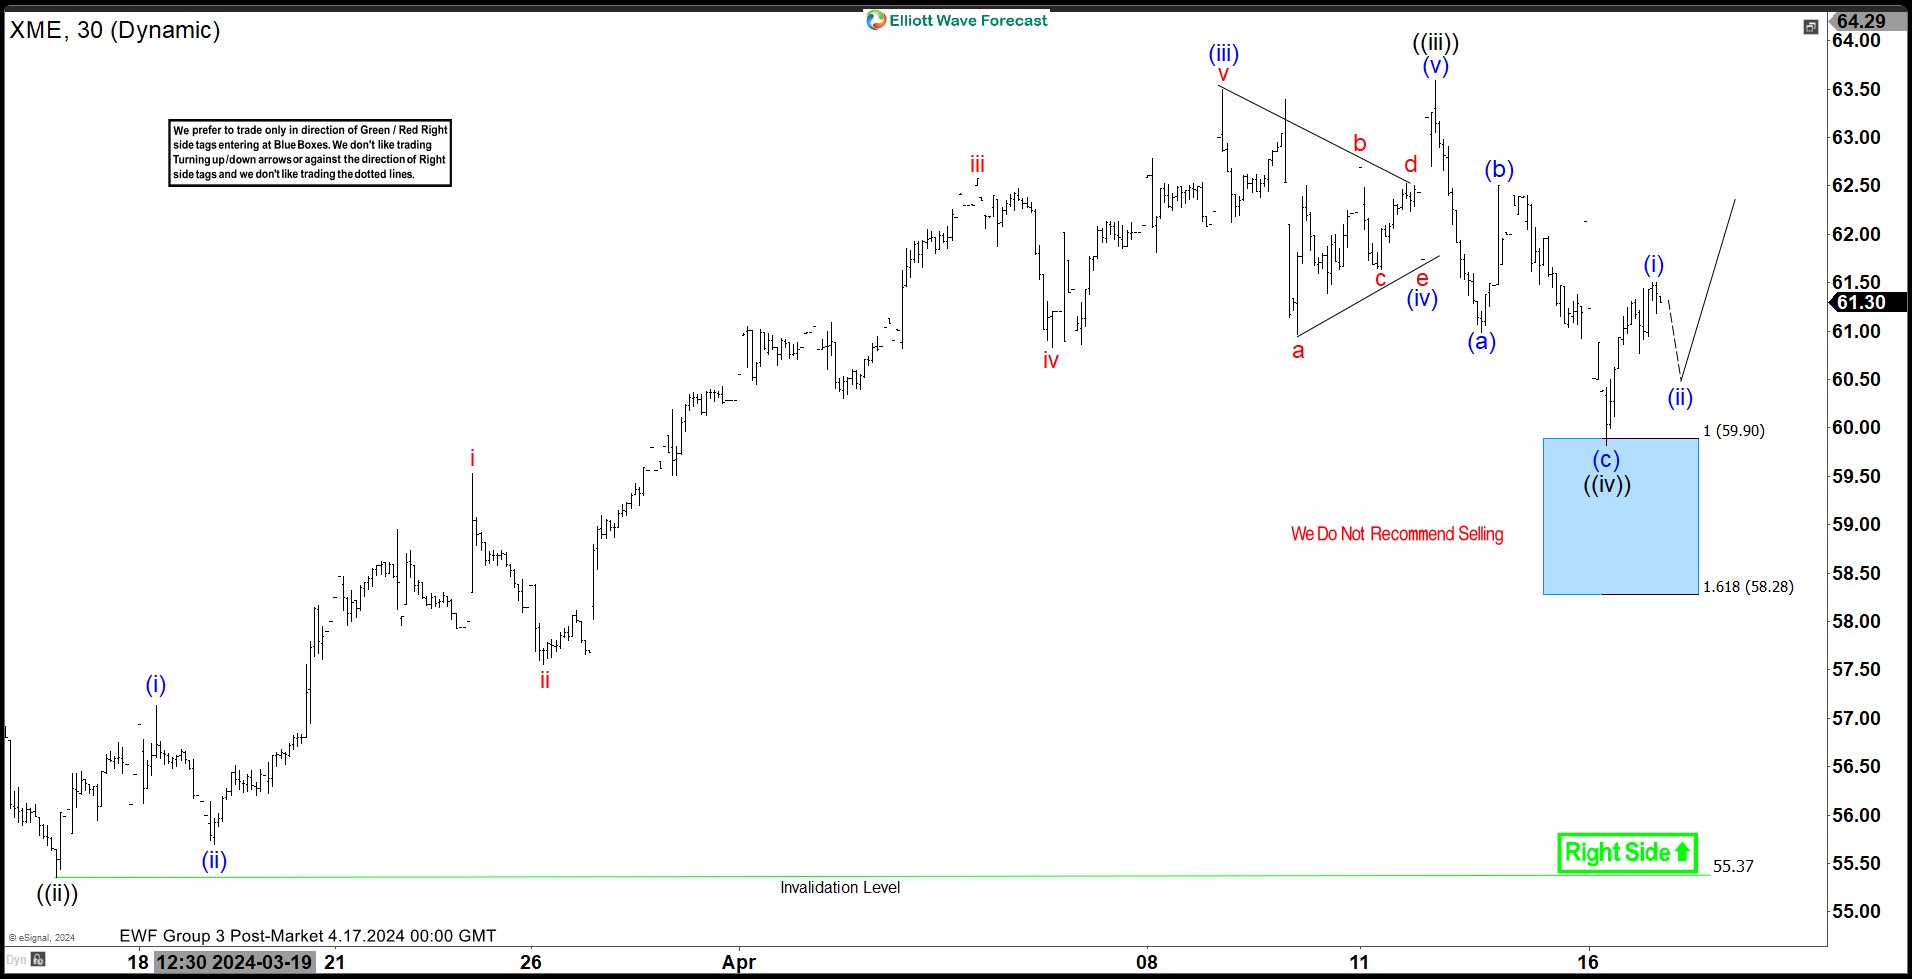 Here is the 1H update from 4.17.2024 showing the bounce taking place as expected. The ETF has reacted higher from the blue box area allowing longs to get risk free before the next leg takes place.
คำชี้แจง (Disclaimer) : เนื้อหาข้างต้นเป็นเพียงมุมมองของผู้เขียนแต่เพียงผู้เดียว และไม่ได้แสดงหรือสะท้อนถึงจุดยืนอย่างเป็นทางการของ Followme แต่อย่างใด Followme ไม่รับผิดชอบต่อความถูกต้อง ความครบถ้วน หรือความน่าเชื่อถือของข้อมูลที่ปรากฏ และจะไม่รับผิดชอบต่อการดำเนินการใด ๆ ที่เกิดขึ้นจากเนื้อหานั้น เว้นแต่จะมีการระบุไว้เป็นลายลักษณ์อักษรอย่างชัดเจน

