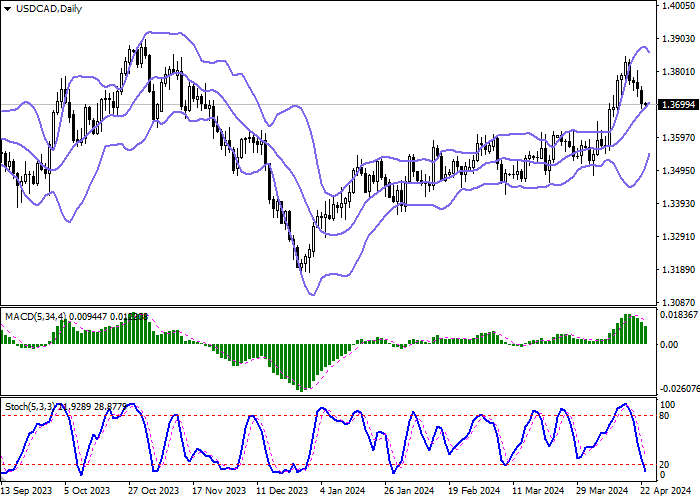
Current trend
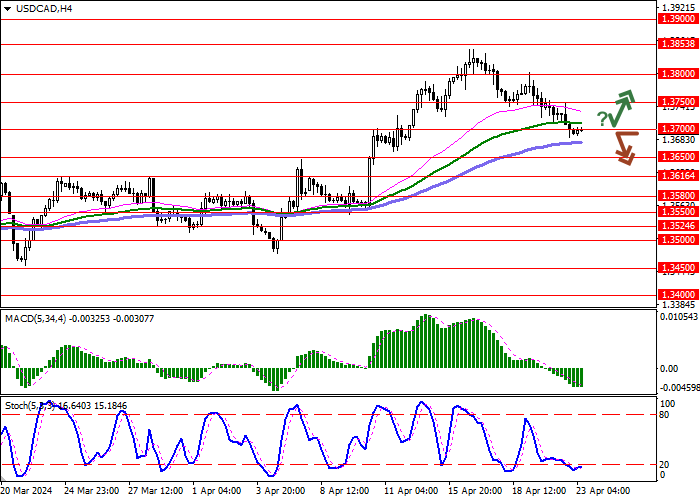
During the Asian session, the USD/CAD pair shows ambiguous trading dynamics, remaining close to the level of 1.3700. Yesterday, the short-term “bearish” trend continued, renewing the lows of April 12.
In March, the Chicago Federal Reserve Bank (FRB) National Activity Index increased from 0.09 points to 0.15 points. In Canada, in the same period, the indicator of housing prices on the primary market showed zero dynamics after growing by 0.1% MoM earlier, and the price index for industrial products slowed from 1.1% to 0.8%, as expected.
The US preliminary Q1 gross domestic product (GDP) data is due at 14:30 (GMT 2) on Thursday. According to preliminary estimates, the indicator will slow from 3.4% to 2.5%. On Friday, at the same time, investors will pay attention to the price index of personal consumption expenditures, an inflation indicator that US Fed officials rely on when making interest rate decisions. Experts suggest that the core value will increase by the same 0.3% MoM and slow down from 2.8% to 2.6% YoY.
Support and resistance
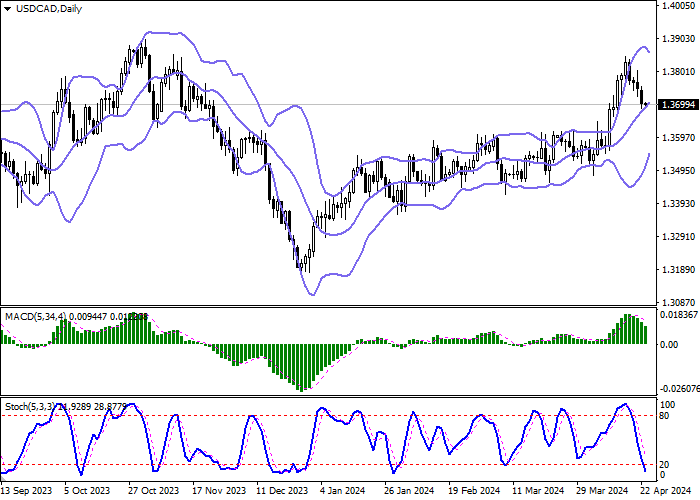
On the daily chart, Bollinger Bands are steadily growing: the price range is narrowing, reflecting the ambiguous nature of trading in the short term. The MACD indicator is declining, maintaining a strong sell signal (the histogram is confidently below the signal line). Stochastic is quickly approaching its lows, so, the asset may become oversold in the ultra-short term.
Resistance levels: 1.3700, 1.3750, 1.3800, 1.3853.
Support levels: 1.3650, 1.3616, 1.3580, 1.3550.
Trading tips
Short positions may be opened after a breakdown of 1.3700, with the target at 1.3616. Stop loss – 1.3750. Implementation time: 2–3 days.
Long positions may be opened after a rebound from 1.3700 and a breakdown of 1.3750, with the target at 1.3853. Stop loss – 1.3700.