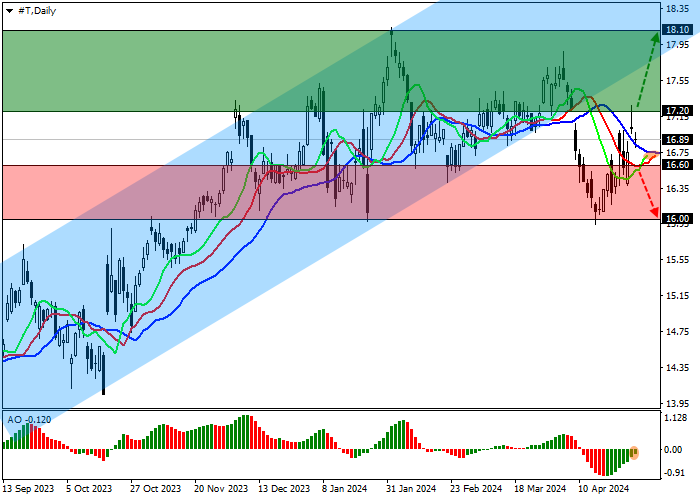
Shares of AT&T Inc., one of the largest American telecommunications conglomerates, are trading at 17.00.
On the daily chart, the price is correcting, completing a reverse test of the support line of the ascending corridor with dynamic boundaries of 18.50–17.00.
On the four-hour chart, the quotes are growing, and consolidation above one of the channel’s lows at 17.00 will allow them to reach 18.00, where the reverse testing will be considered completed. A reversal and decline in the asset are possible, and in this case the key obstacle will be the low of April 16 at 16.00.
Technical indicators are weakening the sell signal: fast EMA on the Alligator indicator are approaching the signal line, and the AO histogram is forming ascending bars in the sell zone.
Trading tips
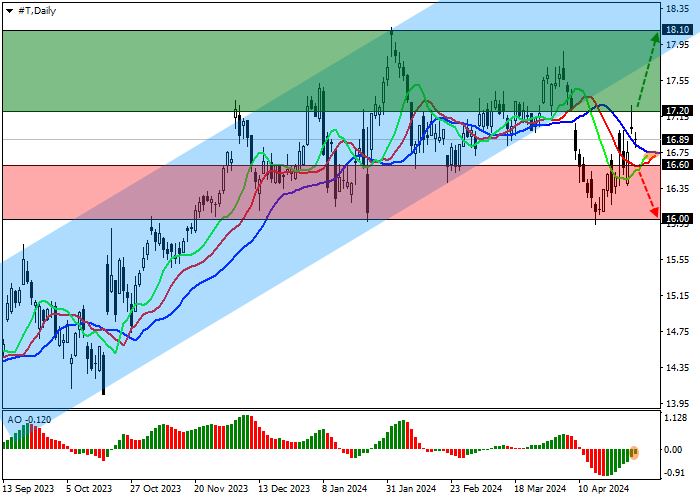
Long positions may be opened after the price rises and consolidates above 17.20, with the target at 18.10. Stop loss – 16.70. Implementation period: 7 days or more.
Short positions may be opened after the price declines and consolidates below 16.60, with the target at 16.00. Stop loss – 17.00.