XAG/USD: WAVE ANALYSIS

avatar
· Views 120


XAG/USD: WAVE ANALYSIS
Scenario
TimeframeWeekly
RecommendationBUY
Entry Point26.56
Take Profit31.65, 35.50
Stop Loss25.00
Key Levels22.03, 23.90, 25.00, 31.65, 35.50
Alternative scenario
RecommendationSELL STOP
Entry Point24.95
Take Profit23.90, 22.03
Stop Loss25.55
Key Levels22.03, 23.90, 25.00, 31.65, 35.50

The price is in a correction and may grow.

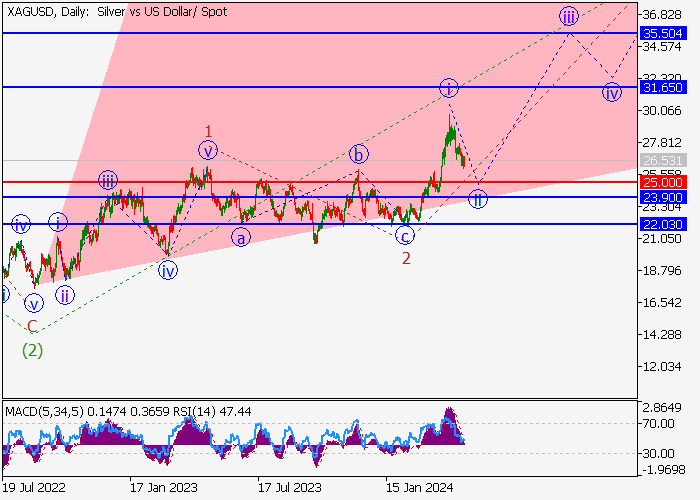
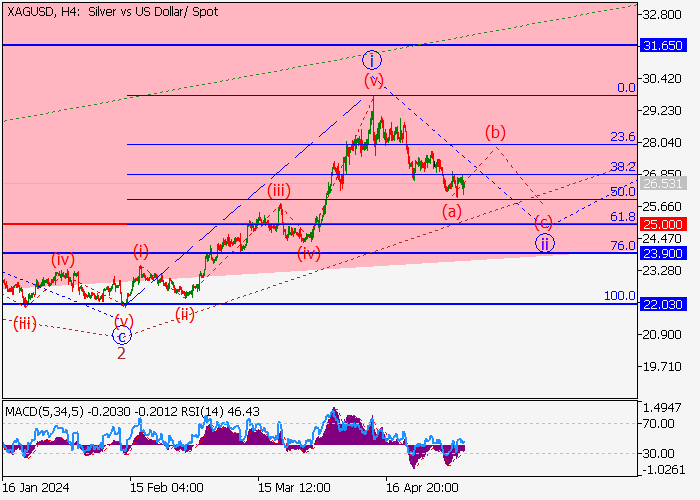
On the daily chart, the third wave of the higher level (3) forms, within which the wave 3 of (3) develops. Now, the entry first wave of the lower level i of 3 has formed, and a local correction is developing as the second wave ii of 3. If the assumption is correct, after the correction the XAG/USD pair will grow to the area of 31.65–35.50. In this scenario, critical stop loss level is 25.00.

XAG/USD: WAVE ANALYSIS

XAG/USD: WAVE ANALYSIS

Main scenario

Long positions will become relevant above the level of 25.00 with the targets at 31.65–35.50. Implementation period: 7 days and more.

Alternative scenario

A breakout and the consolidation of the price below the level of 25.00 will let the asset go down to the area of 23.90–22.03.



คำชี้แจง (Disclaimer) : เนื้อหาข้างต้นเป็นเพียงมุมมองของผู้เขียนแต่เพียงผู้เดียว และไม่ได้แสดงหรือสะท้อนถึงจุดยืนอย่างเป็นทางการของ Followme แต่อย่างใด Followme ไม่รับผิดชอบต่อความถูกต้อง ความครบถ้วน หรือความน่าเชื่อถือของข้อมูลที่ปรากฏ และจะไม่รับผิดชอบต่อการดำเนินการใด ๆ ที่เกิดขึ้นจากเนื้อหานั้น เว้นแต่จะมีการระบุไว้เป็นลายลักษณ์อักษรอย่างชัดเจน

ชอบบทความนี้ไหม? แสดงความขอบคุณโดยการส่งทิปให้ผู้เขียน
ตอบกลับ 0

  • tradingContest