


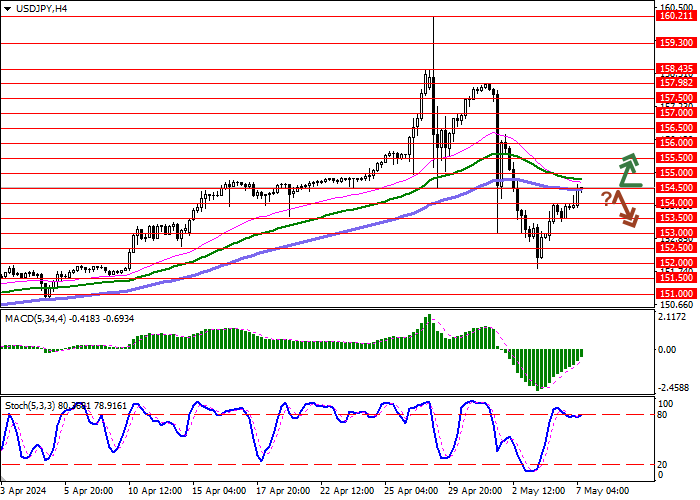
| Scenario | |
|---|---|
| Timeframe | Intraday |
| Recommendation | BUY STOP |
| Entry Point | 154.50 |
| Take Profit | 155.50 |
| Stop Loss | 154.00 |
| Key Levels | 152.50, 153.00, 153.50, 154.00, 154.50, 155.00, 155.50, 156.00 |
| Alternative scenario | |
|---|---|
| Recommendation | SELL STOP |
| Entry Point | 154.00 |
| Take Profit | 153.00 |
| Stop Loss | 154.50 |
| Key Levels | 152.50, 153.00, 153.50, 154.00, 154.50, 155.00, 155.50, 156.00 |
Current trend
The USD/JPY pair is showing moderate growth, developing the "bullish" momentum formed the day before: the instrument is testing 154.50 for a breakout, while analysts expect the emergence of new drivers for the movement and assess the reasons for the sharp rise in the yen last week. Most of them agree that the Bank of Japan nevertheless used the mechanism of foreign exchange intervention, quite openly warning against speculative actions and arguing that market participants contributed to the weakening of the national currency. However, there has been no official confirmation of intervention from the regulator, so markets evaluate only indirect data. According to experts, about 59.0 billion dollars could have been allocated to support the national currency exchange rate, and in the near future officials may try to maintain the rate of the US dollar within the range of 150.00–155.00.
Meanwhile, the US currency is again reversing towards growth, and labor market statistics only put temporary pressure on the instrument. Nonfarm Payrolls slowed down in April from 315.0 thousand to 175.0 thousand against expectations of 243.0 thousand, and the Average Hourly Earnings adjusted from 4.1% to 3.9% in annual terms and from 0.3% to 0.2% on a monthly basis, while the Unemployment Rate rose from 3.8% to 3.9%.
Today, macroeconomic statistics from Japan are exerting some pressure on the yen’s position. The April Services PMI from the national Ministry of Economy, Trade and Industry, which reflects the total cost of services purchased by companies in key service industries (excluding manufacturing), and is a leading indicator of the Tankan business activity index, decreased from 54.6 points to 54.3 points with neutral forecasts.
Support and resistance
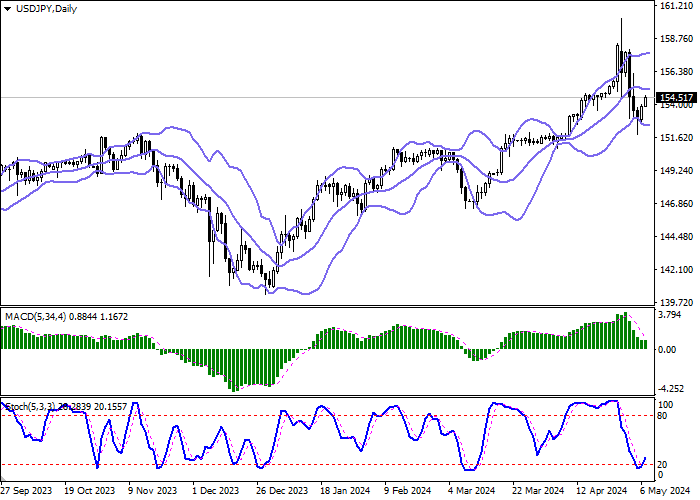
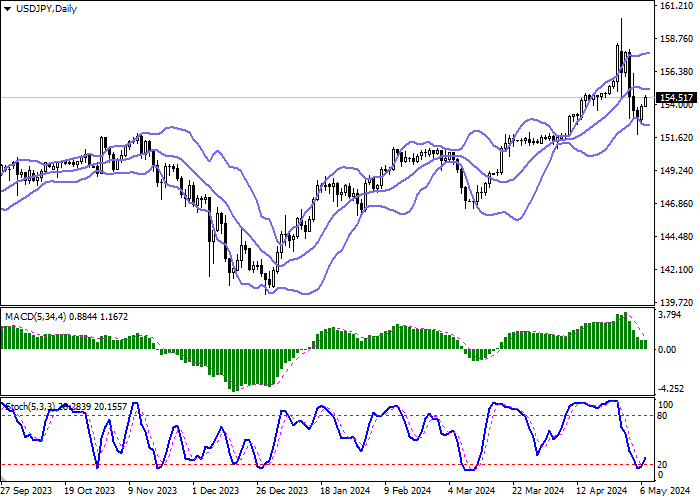
Bollinger Bands in D1 chart demonstrate flat dynamics. The price range is changing slightly, but remains rather spacious for the current level of activity in the market. MACD is trying to reverse upwards preserving its sell signal (located below the signal line). Stochastic shows similar dynamics, retreating from its lows that signal the risks of oversold US dollar in the ultra-short term.
Resistance levels: 154.50, 155.00, 155.50, 156.00.
Support levels: 154.00, 153.50, 153.00, 152.50.
Trading tips
Long positions may be opened after a breakout of 154.50 with the target at 155.50. Stop-loss — 154.00. Implementation time: 1-2 days.
A rebound from 154.50 as from resistance, followed by a breakdown of 154.00 may become a signal for opening of new short positions with the target at 153.00. Stop-loss — 154.50.
คำชี้แจง (Disclaimer) : เนื้อหาข้างต้นเป็นเพียงมุมมองของผู้เขียนแต่เพียงผู้เดียว และไม่ได้แสดงหรือสะท้อนถึงจุดยืนอย่างเป็นทางการของ Followme แต่อย่างใด Followme ไม่รับผิดชอบต่อความถูกต้อง ความครบถ้วน หรือความน่าเชื่อถือของข้อมูลที่ปรากฏ และจะไม่รับผิดชอบต่อการดำเนินการใด ๆ ที่เกิดขึ้นจากเนื้อหานั้น เว้นแต่จะมีการระบุไว้เป็นลายลักษณ์อักษรอย่างชัดเจน

