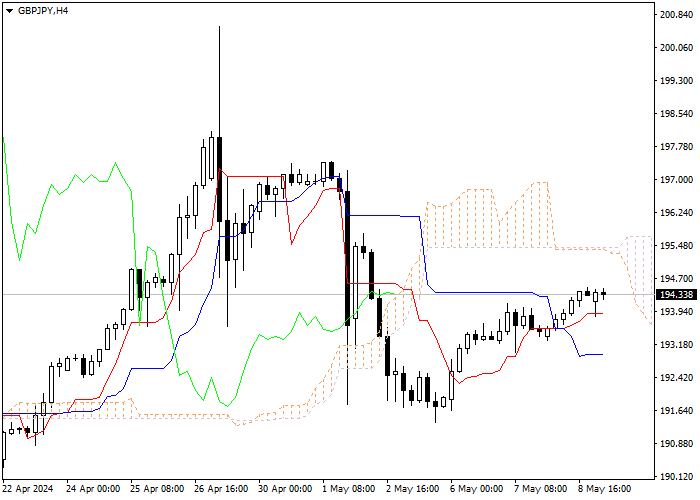
Let's look at the four-hour chart. Tenkan-sen line is above Kijun-sen, the lines are horizontal . Confirmative line Chikou Span has crossed the price chart from below, current cloud is descending. The instrument has broken through Tenkan-sen and Kijun-sen lines. The closest support level is Tenkan-sen line (193.878). One of the previous maximums of Chikou Span line is expected to be a resistance level (194.720).
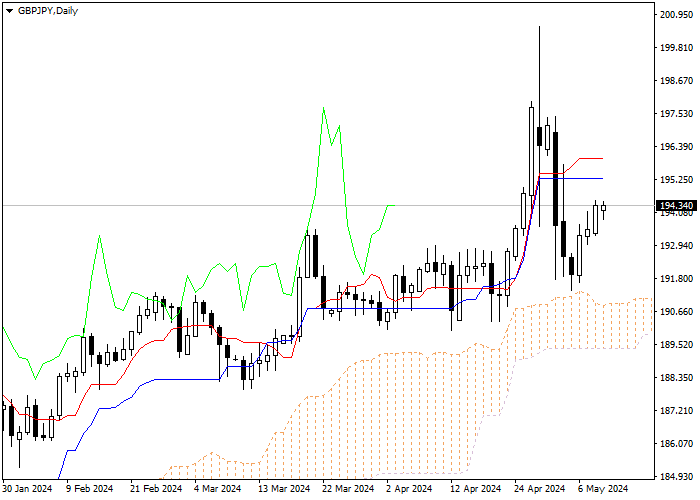
On the daily chart Tenkan-sen line is above Kijun-sen, the lines are horizontal . Confirmative line Chikou Span is above the price chart, current cloud is ascending. The instrument has broken down Tenkan-sen and Kijun-sen lines. One of the previous minimums of Chikou Span line is expected to be a support level (192.740). The closest resistance level is Tenkan-sen line (195.964).
It is recommended to open long positions at current price with Take Profit at the level of previous maximum of Chikou Span (197.992) line and Stop Loss at the level of Kijun-sen line (192.935).