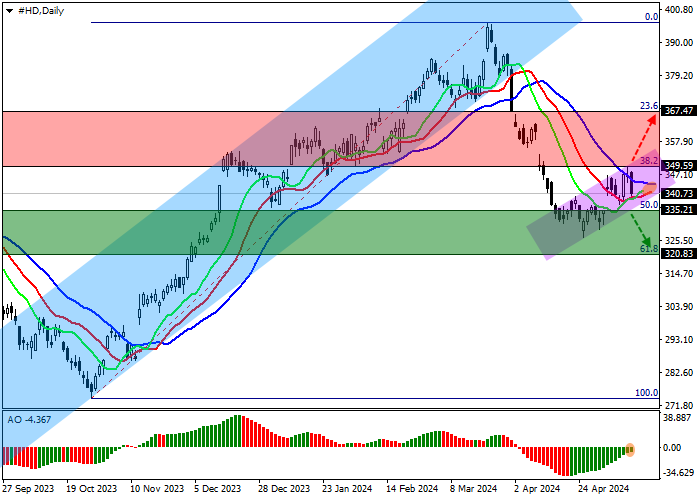
Shares of The Home Depot Inc., the world’s largest home improvement company, are trading at 340.00.
On the daily chart, the price is moving away from the 61.8% Fibonacci full correction level at 320.00.
On the four-hour chart, the downside potential remains high, as the correction develops within the ascending corridor of 350.00–340.00, which can work as a Flag pattern. A significant obstacle to the growth is the core correction of 38.2% at Fibonacci 350.00.
Technical indicators support the decline, working out the correction: the EMA fluctuation range on the Alligator indicator remains stable, and the AO histogram forms correctional bars in the negative zone.
Trading tips
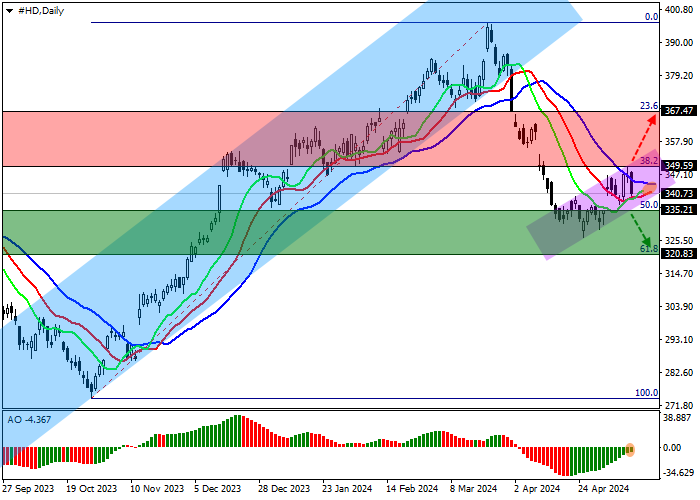
Short positions may be opened after the price declines and consolidates below 335.00, with the target at 320.00. Stop loss – 340.00. Implementation period: 7 days or more.
Long positions may be opened after the price rises and consolidates above 350.00, with the target at 367.00. Stop loss – 345.00.