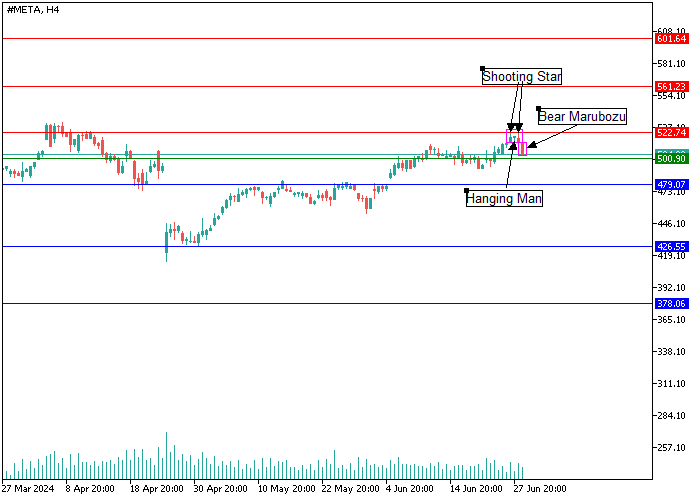
Meta Platforms Inc., H4
On the H4 chart of Meta Platforms Inc. shares, at the resistance level of 522.74, a series of reversal patterns "Shooting Star" and "Hanging Man" is being built, which signal pressure on the price from sellers, and there is also a "Bear Marubozu" model, which emphasizes the weakening potential of buyers. In the current situation, most likely, the trading instrument will continue to decline to the key support level of 479.07, overcoming which will become a catalyst for opening short positions with targets of 426.55–378.06. If the "bulls" can consolidate above the resistance level of 522.74, historical highs may be updated in the area of 561.23–601.64.
Meta Platforms Inc., D1
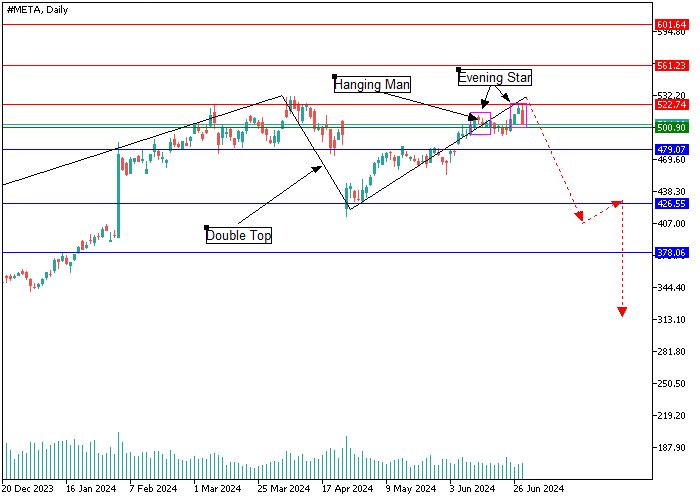
The D1 chart shows the construction of a large "Double Top" model after the value of securities reached a new historical maximum at 531.36. In addition, at the levels of 522.74–500.90, the quotes formed "bearish" candlestick patterns "Hanging Man" and "Evening Star", which signal an upcoming trend change to a downward one. Most likely, the price will continue to decline to the key support level of 479.07, overcoming which may strengthen the negative dynamics down to the level of 378.06.
Support and resistance
Support levels: 479.07, 426.55, 378.06.
Resistance levels: 522.74, 561.23, 601.64.
Trading tips
Short positions can be opened below 479.07 with targets of 426.55, 378.06. Stop-loss – 500.90. Implementation time: 7 days and more.
Long positions can be opened above the 522.74 mark with targets of 561.23, 601.64. Stop-loss – 500.90.